Immigrants from North America vs Immigrants from Fiji College, 1 year or more
COMPARE
Immigrants from North America
Immigrants from Fiji
College, 1 year or more
College, 1 year or more Comparison
Immigrants from North America
Immigrants from Fiji
63.0%
COLLEGE, 1 YEAR OR MORE
99.0/ 100
METRIC RATING
74th/ 347
METRIC RANK
56.9%
COLLEGE, 1 YEAR OR MORE
4.0/ 100
METRIC RATING
228th/ 347
METRIC RANK
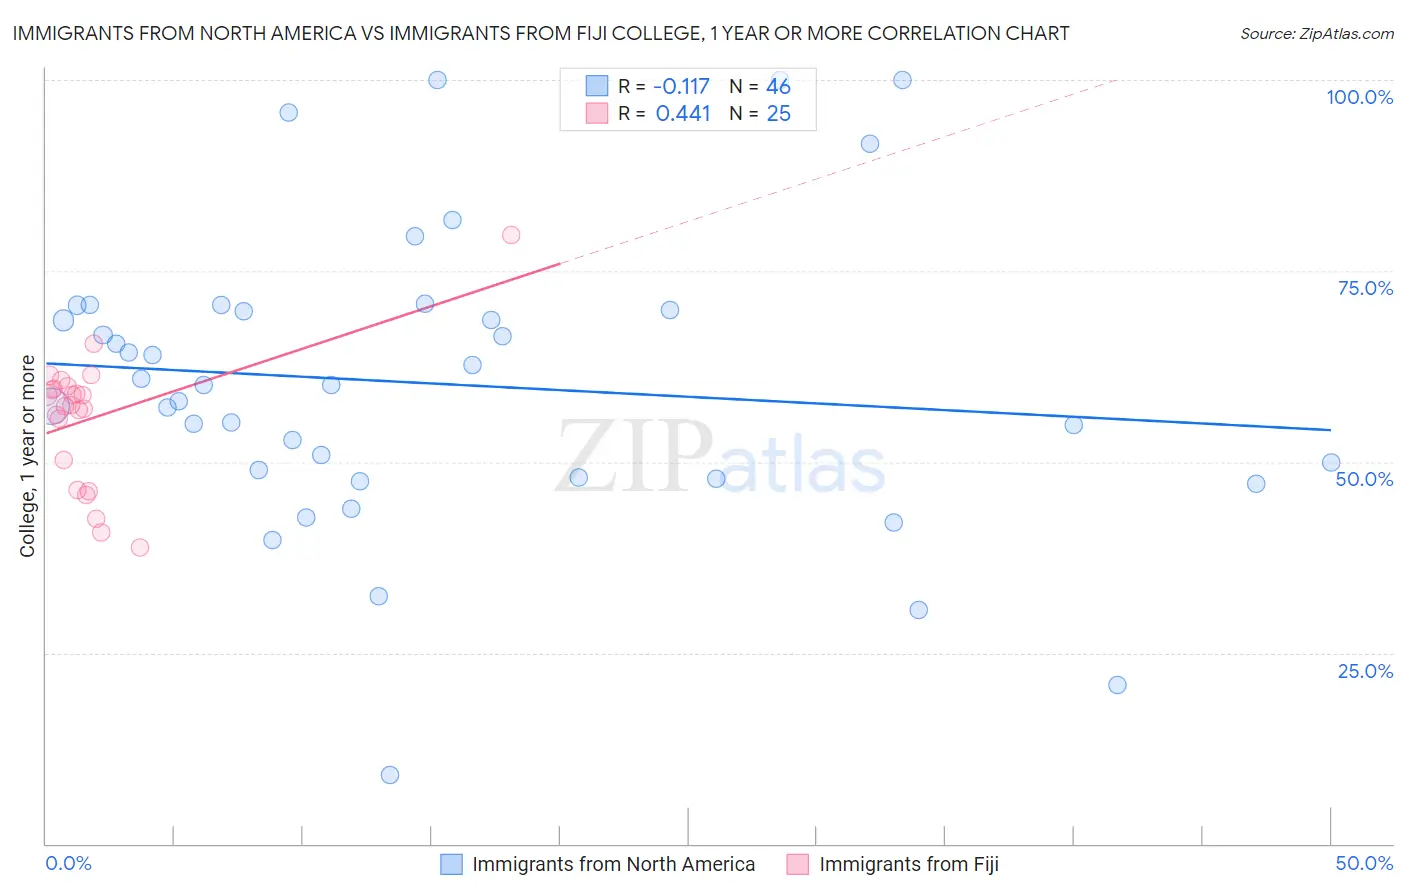
Immigrants from North America vs Immigrants from Fiji College, 1 year or more Correlation Chart
The statistical analysis conducted on geographies consisting of 462,456,246 people shows a poor negative correlation between the proportion of Immigrants from North America and percentage of population with at least college, 1 year or more education in the United States with a correlation coefficient (R) of -0.117 and weighted average of 63.0%. Similarly, the statistical analysis conducted on geographies consisting of 93,755,737 people shows a moderate positive correlation between the proportion of Immigrants from Fiji and percentage of population with at least college, 1 year or more education in the United States with a correlation coefficient (R) of 0.441 and weighted average of 56.9%, a difference of 10.8%.
College, 1 year or more Correlation Summary
| Measurement | Immigrants from North America | Immigrants from Fiji |
| Minimum | 9.0% | 38.9% |
| Maximum | 100.0% | 79.8% |
| Range | 91.0% | 40.9% |
| Mean | 60.2% | 55.8% |
| Median | 60.0% | 57.5% |
| Interquartile 25% (IQ1) | 47.9% | 48.2% |
| Interquartile 75% (IQ3) | 69.9% | 59.8% |
| Interquartile Range (IQR) | 22.0% | 11.5% |
| Standard Deviation (Sample) | 19.4% | 8.8% |
| Standard Deviation (Population) | 19.2% | 8.6% |
Similar Demographics by College, 1 year or more
Demographics Similar to Immigrants from North America by College, 1 year or more
In terms of college, 1 year or more, the demographic groups most similar to Immigrants from North America are Immigrants from Moldova (63.0%, a difference of 0.020%), Egyptian (63.1%, a difference of 0.030%), Immigrants from Canada (63.1%, a difference of 0.080%), Armenian (63.0%, a difference of 0.090%), and Paraguayan (62.9%, a difference of 0.19%).
| Demographics | Rating | Rank | College, 1 year or more |
| Immigrants | Romania | 99.3 /100 | #67 | Exceptional 63.3% |
| Immigrants | Greece | 99.3 /100 | #68 | Exceptional 63.3% |
| Immigrants | Zimbabwe | 99.3 /100 | #69 | Exceptional 63.3% |
| Argentineans | 99.2 /100 | #70 | Exceptional 63.2% |
| Immigrants | Canada | 99.1 /100 | #71 | Exceptional 63.1% |
| Egyptians | 99.0 /100 | #72 | Exceptional 63.1% |
| Immigrants | Moldova | 99.0 /100 | #73 | Exceptional 63.0% |
| Immigrants | North America | 99.0 /100 | #74 | Exceptional 63.0% |
| Armenians | 98.9 /100 | #75 | Exceptional 63.0% |
| Paraguayans | 98.8 /100 | #76 | Exceptional 62.9% |
| Ethiopians | 98.8 /100 | #77 | Exceptional 62.9% |
| Immigrants | Lebanon | 98.8 /100 | #78 | Exceptional 62.9% |
| Northern Europeans | 98.8 /100 | #79 | Exceptional 62.9% |
| Lithuanians | 98.8 /100 | #80 | Exceptional 62.9% |
| Laotians | 98.7 /100 | #81 | Exceptional 62.8% |
Demographics Similar to Immigrants from Fiji by College, 1 year or more
In terms of college, 1 year or more, the demographic groups most similar to Immigrants from Fiji are Cree (56.8%, a difference of 0.13%), Immigrants (57.0%, a difference of 0.15%), Immigrants from Western Africa (57.0%, a difference of 0.21%), Vietnamese (57.0%, a difference of 0.24%), and Liberian (56.7%, a difference of 0.35%).
| Demographics | Rating | Rank | College, 1 year or more |
| Immigrants | Ghana | 7.7 /100 | #221 | Tragic 57.4% |
| Sub-Saharan Africans | 6.1 /100 | #222 | Tragic 57.3% |
| Portuguese | 5.4 /100 | #223 | Tragic 57.2% |
| Hmong | 5.4 /100 | #224 | Tragic 57.2% |
| Vietnamese | 4.7 /100 | #225 | Tragic 57.0% |
| Immigrants | Western Africa | 4.6 /100 | #226 | Tragic 57.0% |
| Immigrants | Immigrants | 4.4 /100 | #227 | Tragic 57.0% |
| Immigrants | Fiji | 4.0 /100 | #228 | Tragic 56.9% |
| Cree | 3.6 /100 | #229 | Tragic 56.8% |
| Liberians | 3.1 /100 | #230 | Tragic 56.7% |
| Immigrants | Burma/Myanmar | 2.7 /100 | #231 | Tragic 56.6% |
| Immigrants | Bangladesh | 2.6 /100 | #232 | Tragic 56.6% |
| Immigrants | Nonimmigrants | 2.5 /100 | #233 | Tragic 56.5% |
| Spanish Americans | 1.8 /100 | #234 | Tragic 56.3% |
| West Indians | 1.8 /100 | #235 | Tragic 56.3% |