Immigrants from Nigeria vs Pakistani Professional Degree
COMPARE
Immigrants from Nigeria
Pakistani
Professional Degree
Professional Degree Comparison
Immigrants from Nigeria
Pakistanis
4.1%
PROFESSIONAL DEGREE
11.7/ 100
METRIC RATING
210th/ 347
METRIC RANK
4.8%
PROFESSIONAL DEGREE
90.9/ 100
METRIC RATING
132nd/ 347
METRIC RANK
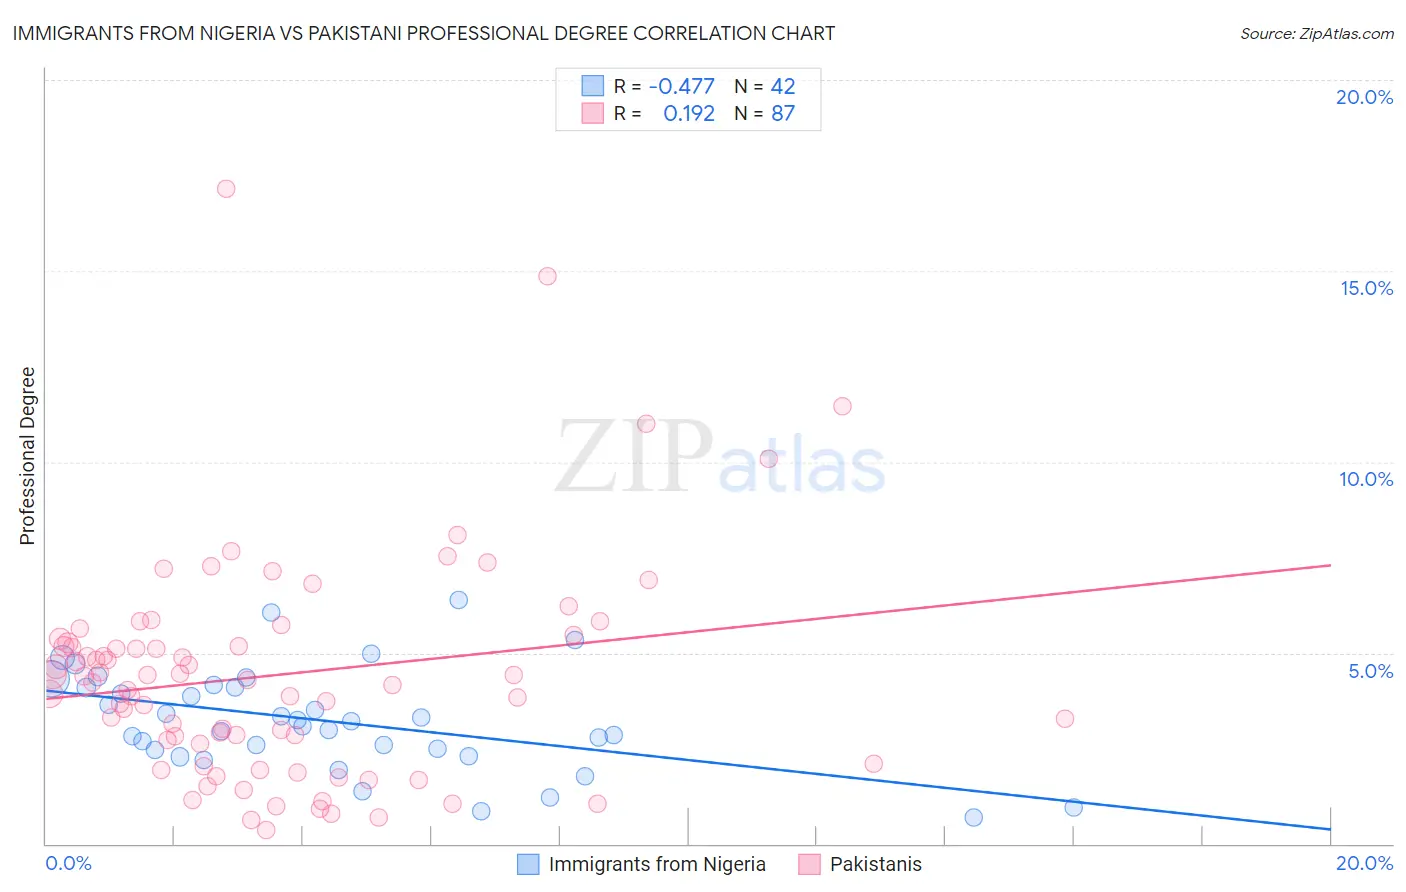
Immigrants from Nigeria vs Pakistani Professional Degree Correlation Chart
The statistical analysis conducted on geographies consisting of 283,120,883 people shows a moderate negative correlation between the proportion of Immigrants from Nigeria and percentage of population with at least professional degree education in the United States with a correlation coefficient (R) of -0.477 and weighted average of 4.1%. Similarly, the statistical analysis conducted on geographies consisting of 334,796,739 people shows a poor positive correlation between the proportion of Pakistanis and percentage of population with at least professional degree education in the United States with a correlation coefficient (R) of 0.192 and weighted average of 4.8%, a difference of 16.9%.
Professional Degree Correlation Summary
| Measurement | Immigrants from Nigeria | Pakistani |
| Minimum | 0.69% | 0.37% |
| Maximum | 6.4% | 17.1% |
| Range | 5.7% | 16.8% |
| Mean | 3.2% | 4.4% |
| Median | 3.1% | 4.3% |
| Interquartile 25% (IQ1) | 2.5% | 2.6% |
| Interquartile 75% (IQ3) | 4.1% | 5.4% |
| Interquartile Range (IQR) | 1.6% | 2.8% |
| Standard Deviation (Sample) | 1.3% | 2.9% |
| Standard Deviation (Population) | 1.3% | 2.9% |
Similar Demographics by Professional Degree
Demographics Similar to Immigrants from Nigeria by Professional Degree
In terms of professional degree, the demographic groups most similar to Immigrants from Nigeria are German (4.1%, a difference of 0.030%), White/Caucasian (4.1%, a difference of 0.21%), Immigrants from Panama (4.1%, a difference of 0.22%), Immigrants from Somalia (4.1%, a difference of 0.30%), and Subsaharan African (4.1%, a difference of 0.38%).
| Demographics | Rating | Rank | Professional Degree |
| Panamanians | 15.9 /100 | #203 | Poor 4.1% |
| Barbadians | 15.8 /100 | #204 | Poor 4.1% |
| Somalis | 14.8 /100 | #205 | Poor 4.1% |
| Yugoslavians | 13.4 /100 | #206 | Poor 4.1% |
| Sub-Saharan Africans | 12.8 /100 | #207 | Poor 4.1% |
| Immigrants | Somalia | 12.5 /100 | #208 | Poor 4.1% |
| Immigrants | Panama | 12.3 /100 | #209 | Poor 4.1% |
| Immigrants | Nigeria | 11.7 /100 | #210 | Poor 4.1% |
| Germans | 11.6 /100 | #211 | Poor 4.1% |
| Whites/Caucasians | 11.2 /100 | #212 | Poor 4.1% |
| Koreans | 10.7 /100 | #213 | Poor 4.1% |
| Immigrants | Ghana | 10.6 /100 | #214 | Poor 4.1% |
| Portuguese | 10.5 /100 | #215 | Poor 4.1% |
| West Indians | 9.8 /100 | #216 | Tragic 4.1% |
| Immigrants | Vietnam | 9.4 /100 | #217 | Tragic 4.0% |
Demographics Similar to Pakistanis by Professional Degree
In terms of professional degree, the demographic groups most similar to Pakistanis are Immigrants from Nepal (4.8%, a difference of 0.22%), Icelander (4.8%, a difference of 0.25%), Italian (4.8%, a difference of 0.25%), Palestinian (4.8%, a difference of 0.27%), and South American Indian (4.8%, a difference of 0.38%).
| Demographics | Rating | Rank | Professional Degree |
| Immigrants | Albania | 93.3 /100 | #125 | Exceptional 4.8% |
| Europeans | 93.2 /100 | #126 | Exceptional 4.8% |
| Serbians | 92.6 /100 | #127 | Exceptional 4.8% |
| Immigrants | Eastern Africa | 92.5 /100 | #128 | Exceptional 4.8% |
| Palestinians | 91.5 /100 | #129 | Exceptional 4.8% |
| Icelanders | 91.5 /100 | #130 | Exceptional 4.8% |
| Immigrants | Nepal | 91.4 /100 | #131 | Exceptional 4.8% |
| Pakistanis | 90.9 /100 | #132 | Exceptional 4.8% |
| Italians | 90.2 /100 | #133 | Exceptional 4.8% |
| South American Indians | 89.9 /100 | #134 | Excellent 4.8% |
| Macedonians | 89.8 /100 | #135 | Excellent 4.8% |
| Immigrants | Jordan | 89.0 /100 | #136 | Excellent 4.7% |
| Jordanians | 88.9 /100 | #137 | Excellent 4.7% |
| Afghans | 88.8 /100 | #138 | Excellent 4.7% |
| South Americans | 85.6 /100 | #139 | Excellent 4.7% |