English vs Immigrants from Trinidad and Tobago GED/Equivalency
COMPARE
English
Immigrants from Trinidad and Tobago
GED/Equivalency
GED/Equivalency Comparison
English
Immigrants from Trinidad and Tobago
87.6%
GED/EQUIVALENCY
98.6/ 100
METRIC RATING
79th/ 347
METRIC RANK
82.8%
GED/EQUIVALENCY
0.1/ 100
METRIC RATING
274th/ 347
METRIC RANK
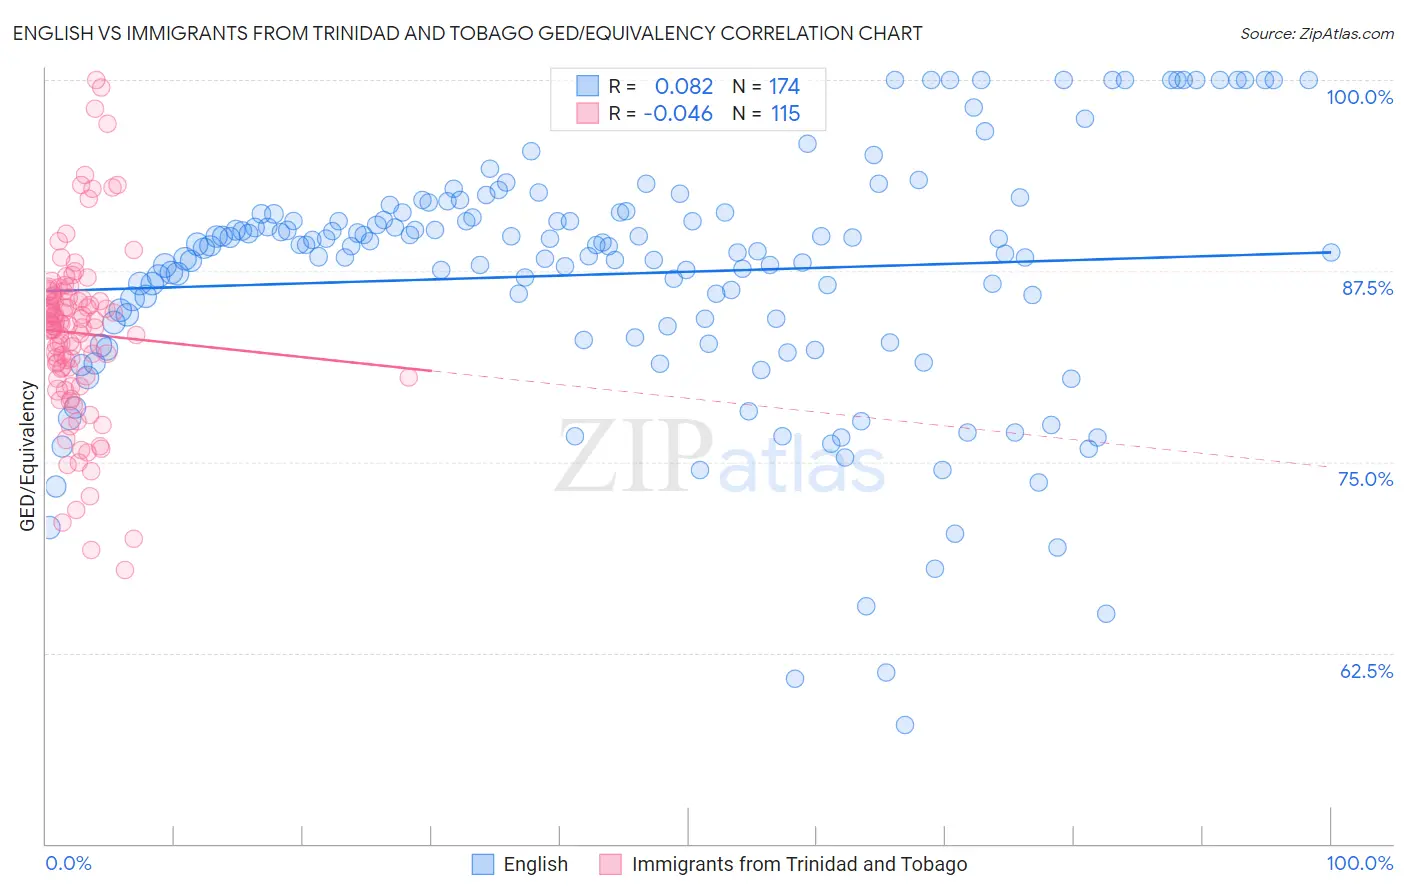
English vs Immigrants from Trinidad and Tobago GED/Equivalency Correlation Chart
The statistical analysis conducted on geographies consisting of 579,979,946 people shows a slight positive correlation between the proportion of English and percentage of population with at least ged/equivalency education in the United States with a correlation coefficient (R) of 0.082 and weighted average of 87.6%. Similarly, the statistical analysis conducted on geographies consisting of 223,527,464 people shows no correlation between the proportion of Immigrants from Trinidad and Tobago and percentage of population with at least ged/equivalency education in the United States with a correlation coefficient (R) of -0.046 and weighted average of 82.8%, a difference of 5.8%.
GED/Equivalency Correlation Summary
| Measurement | English | Immigrants from Trinidad and Tobago |
| Minimum | 57.8% | 67.9% |
| Maximum | 100.0% | 100.0% |
| Range | 42.2% | 32.1% |
| Mean | 87.3% | 83.4% |
| Median | 89.1% | 83.9% |
| Interquartile 25% (IQ1) | 83.9% | 80.6% |
| Interquartile 75% (IQ3) | 91.2% | 85.8% |
| Interquartile Range (IQR) | 7.3% | 5.2% |
| Standard Deviation (Sample) | 8.1% | 5.7% |
| Standard Deviation (Population) | 8.1% | 5.7% |
Similar Demographics by GED/Equivalency
Demographics Similar to English by GED/Equivalency
In terms of ged/equivalency, the demographic groups most similar to English are Irish (87.6%, a difference of 0.030%), Immigrants from England (87.6%, a difference of 0.030%), Immigrants from Serbia (87.7%, a difference of 0.050%), Slavic (87.7%, a difference of 0.050%), and Scottish (87.7%, a difference of 0.070%).
| Demographics | Rating | Rank | GED/Equivalency |
| Immigrants | Moldova | 98.8 /100 | #72 | Exceptional 87.7% |
| Belgians | 98.8 /100 | #73 | Exceptional 87.7% |
| Immigrants | Kuwait | 98.8 /100 | #74 | Exceptional 87.7% |
| Scottish | 98.7 /100 | #75 | Exceptional 87.7% |
| Immigrants | Serbia | 98.7 /100 | #76 | Exceptional 87.7% |
| Slavs | 98.7 /100 | #77 | Exceptional 87.7% |
| Irish | 98.6 /100 | #78 | Exceptional 87.6% |
| English | 98.6 /100 | #79 | Exceptional 87.6% |
| Immigrants | England | 98.5 /100 | #80 | Exceptional 87.6% |
| Immigrants | Sri Lanka | 98.3 /100 | #81 | Exceptional 87.5% |
| Romanians | 98.3 /100 | #82 | Exceptional 87.5% |
| South Africans | 98.3 /100 | #83 | Exceptional 87.5% |
| Immigrants | Romania | 98.1 /100 | #84 | Exceptional 87.5% |
| Dutch | 98.1 /100 | #85 | Exceptional 87.5% |
| Immigrants | Europe | 98.1 /100 | #86 | Exceptional 87.5% |
Demographics Similar to Immigrants from Trinidad and Tobago by GED/Equivalency
In terms of ged/equivalency, the demographic groups most similar to Immigrants from Trinidad and Tobago are Barbadian (82.9%, a difference of 0.020%), Pennsylvania German (82.9%, a difference of 0.020%), Seminole (82.8%, a difference of 0.060%), U.S. Virgin Islander (82.9%, a difference of 0.070%), and Black/African American (82.8%, a difference of 0.080%).
| Demographics | Rating | Rank | GED/Equivalency |
| Trinidadians and Tobagonians | 0.2 /100 | #267 | Tragic 83.0% |
| Immigrants | Burma/Myanmar | 0.2 /100 | #268 | Tragic 83.0% |
| Hopi | 0.2 /100 | #269 | Tragic 83.0% |
| Immigrants | Jamaica | 0.2 /100 | #270 | Tragic 82.9% |
| U.S. Virgin Islanders | 0.2 /100 | #271 | Tragic 82.9% |
| Barbadians | 0.1 /100 | #272 | Tragic 82.9% |
| Pennsylvania Germans | 0.1 /100 | #273 | Tragic 82.9% |
| Immigrants | Trinidad and Tobago | 0.1 /100 | #274 | Tragic 82.8% |
| Seminole | 0.1 /100 | #275 | Tragic 82.8% |
| Blacks/African Americans | 0.1 /100 | #276 | Tragic 82.8% |
| Arapaho | 0.1 /100 | #277 | Tragic 82.8% |
| Immigrants | Laos | 0.1 /100 | #278 | Tragic 82.7% |
| Immigrants | Fiji | 0.1 /100 | #279 | Tragic 82.7% |
| Cheyenne | 0.1 /100 | #280 | Tragic 82.7% |
| Sioux | 0.1 /100 | #281 | Tragic 82.6% |