Immigrants from Western Africa vs Immigrants from Trinidad and Tobago GED/Equivalency
COMPARE
Immigrants from Western Africa
Immigrants from Trinidad and Tobago
GED/Equivalency
GED/Equivalency Comparison
Immigrants from Western Africa
Immigrants from Trinidad and Tobago
83.8%
GED/EQUIVALENCY
1.1/ 100
METRIC RATING
247th/ 347
METRIC RANK
82.8%
GED/EQUIVALENCY
0.1/ 100
METRIC RATING
274th/ 347
METRIC RANK
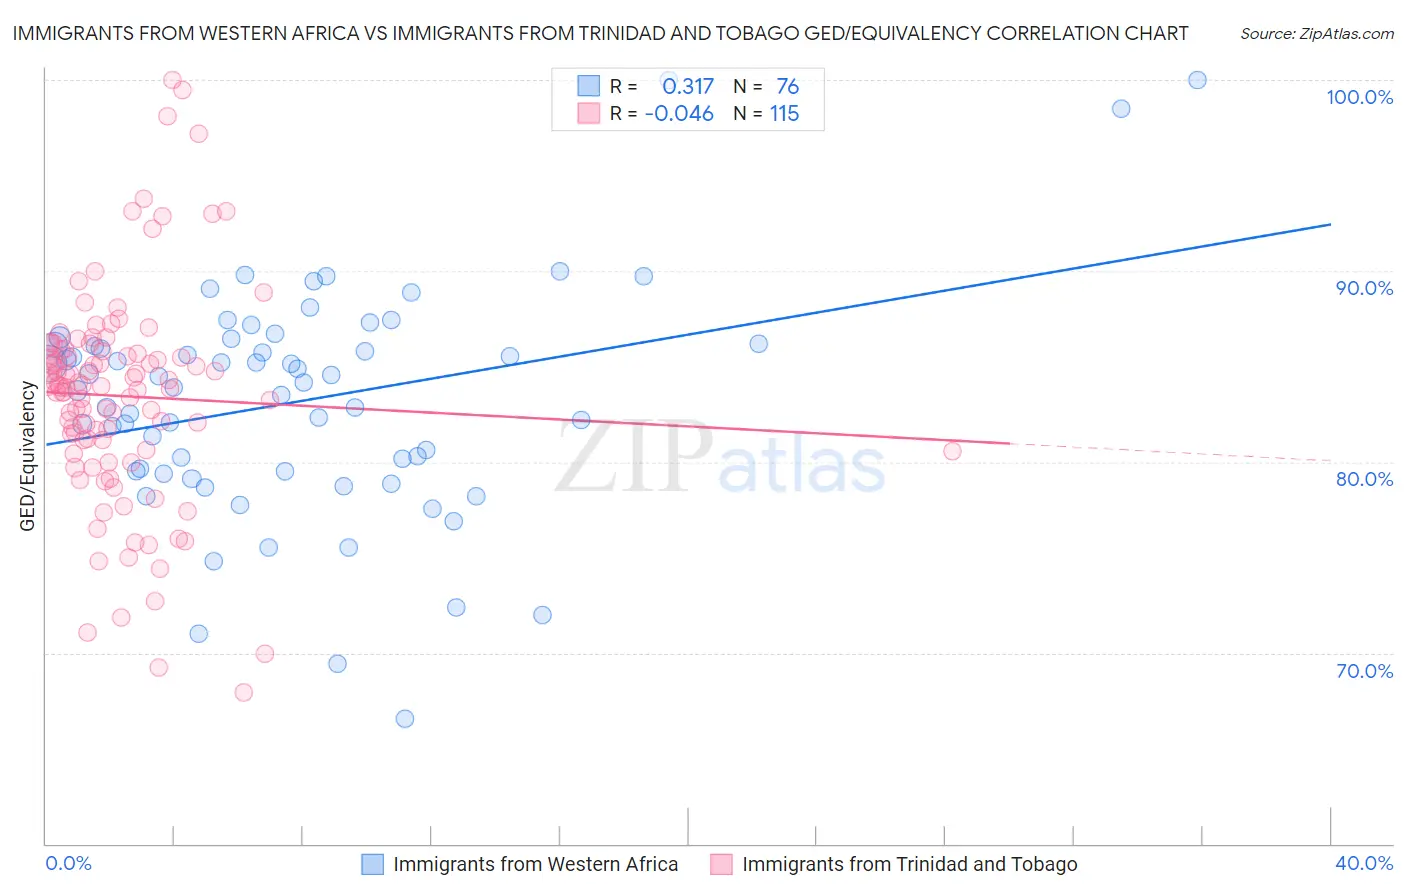
Immigrants from Western Africa vs Immigrants from Trinidad and Tobago GED/Equivalency Correlation Chart
The statistical analysis conducted on geographies consisting of 357,885,284 people shows a mild positive correlation between the proportion of Immigrants from Western Africa and percentage of population with at least ged/equivalency education in the United States with a correlation coefficient (R) of 0.317 and weighted average of 83.8%. Similarly, the statistical analysis conducted on geographies consisting of 223,527,464 people shows no correlation between the proportion of Immigrants from Trinidad and Tobago and percentage of population with at least ged/equivalency education in the United States with a correlation coefficient (R) of -0.046 and weighted average of 82.8%, a difference of 1.1%.
GED/Equivalency Correlation Summary
| Measurement | Immigrants from Western Africa | Immigrants from Trinidad and Tobago |
| Minimum | 66.5% | 67.9% |
| Maximum | 100.0% | 100.0% |
| Range | 33.5% | 32.1% |
| Mean | 83.2% | 83.4% |
| Median | 84.0% | 83.9% |
| Interquartile 25% (IQ1) | 79.5% | 80.6% |
| Interquartile 75% (IQ3) | 86.2% | 85.8% |
| Interquartile Range (IQR) | 6.7% | 5.2% |
| Standard Deviation (Sample) | 6.0% | 5.7% |
| Standard Deviation (Population) | 5.9% | 5.7% |
Similar Demographics by GED/Equivalency
Demographics Similar to Immigrants from Western Africa by GED/Equivalency
In terms of ged/equivalency, the demographic groups most similar to Immigrants from Western Africa are Blackfeet (83.8%, a difference of 0.020%), Crow (83.8%, a difference of 0.020%), Chickasaw (83.8%, a difference of 0.030%), Shoshone (83.7%, a difference of 0.040%), and Immigrants from Senegal (83.8%, a difference of 0.050%).
| Demographics | Rating | Rank | GED/Equivalency |
| Immigrants | South Eastern Asia | 2.5 /100 | #240 | Tragic 84.1% |
| Senegalese | 1.9 /100 | #241 | Tragic 84.0% |
| Sri Lankans | 1.9 /100 | #242 | Tragic 84.0% |
| Cherokee | 1.3 /100 | #243 | Tragic 83.9% |
| Immigrants | Ghana | 1.3 /100 | #244 | Tragic 83.9% |
| Immigrants | Senegal | 1.2 /100 | #245 | Tragic 83.8% |
| Chickasaw | 1.2 /100 | #246 | Tragic 83.8% |
| Immigrants | Western Africa | 1.1 /100 | #247 | Tragic 83.8% |
| Blackfeet | 1.1 /100 | #248 | Tragic 83.8% |
| Crow | 1.1 /100 | #249 | Tragic 83.8% |
| Shoshone | 1.0 /100 | #250 | Tragic 83.7% |
| Spanish Americans | 0.8 /100 | #251 | Tragic 83.6% |
| Bahamians | 0.8 /100 | #252 | Tragic 83.6% |
| Comanche | 0.7 /100 | #253 | Tragic 83.6% |
| Creek | 0.7 /100 | #254 | Tragic 83.6% |
Demographics Similar to Immigrants from Trinidad and Tobago by GED/Equivalency
In terms of ged/equivalency, the demographic groups most similar to Immigrants from Trinidad and Tobago are Barbadian (82.9%, a difference of 0.020%), Pennsylvania German (82.9%, a difference of 0.020%), Seminole (82.8%, a difference of 0.060%), U.S. Virgin Islander (82.9%, a difference of 0.070%), and Black/African American (82.8%, a difference of 0.080%).
| Demographics | Rating | Rank | GED/Equivalency |
| Trinidadians and Tobagonians | 0.2 /100 | #267 | Tragic 83.0% |
| Immigrants | Burma/Myanmar | 0.2 /100 | #268 | Tragic 83.0% |
| Hopi | 0.2 /100 | #269 | Tragic 83.0% |
| Immigrants | Jamaica | 0.2 /100 | #270 | Tragic 82.9% |
| U.S. Virgin Islanders | 0.2 /100 | #271 | Tragic 82.9% |
| Barbadians | 0.1 /100 | #272 | Tragic 82.9% |
| Pennsylvania Germans | 0.1 /100 | #273 | Tragic 82.9% |
| Immigrants | Trinidad and Tobago | 0.1 /100 | #274 | Tragic 82.8% |
| Seminole | 0.1 /100 | #275 | Tragic 82.8% |
| Blacks/African Americans | 0.1 /100 | #276 | Tragic 82.8% |
| Arapaho | 0.1 /100 | #277 | Tragic 82.8% |
| Immigrants | Laos | 0.1 /100 | #278 | Tragic 82.7% |
| Immigrants | Fiji | 0.1 /100 | #279 | Tragic 82.7% |
| Cheyenne | 0.1 /100 | #280 | Tragic 82.7% |
| Sioux | 0.1 /100 | #281 | Tragic 82.6% |