German Russian vs Immigrants from Bangladesh College, 1 year or more
COMPARE
German Russian
Immigrants from Bangladesh
College, 1 year or more
College, 1 year or more Comparison
German Russians
Immigrants from Bangladesh
59.1%
COLLEGE, 1 YEAR OR MORE
39.3/ 100
METRIC RATING
183rd/ 347
METRIC RANK
56.6%
COLLEGE, 1 YEAR OR MORE
2.6/ 100
METRIC RATING
232nd/ 347
METRIC RANK
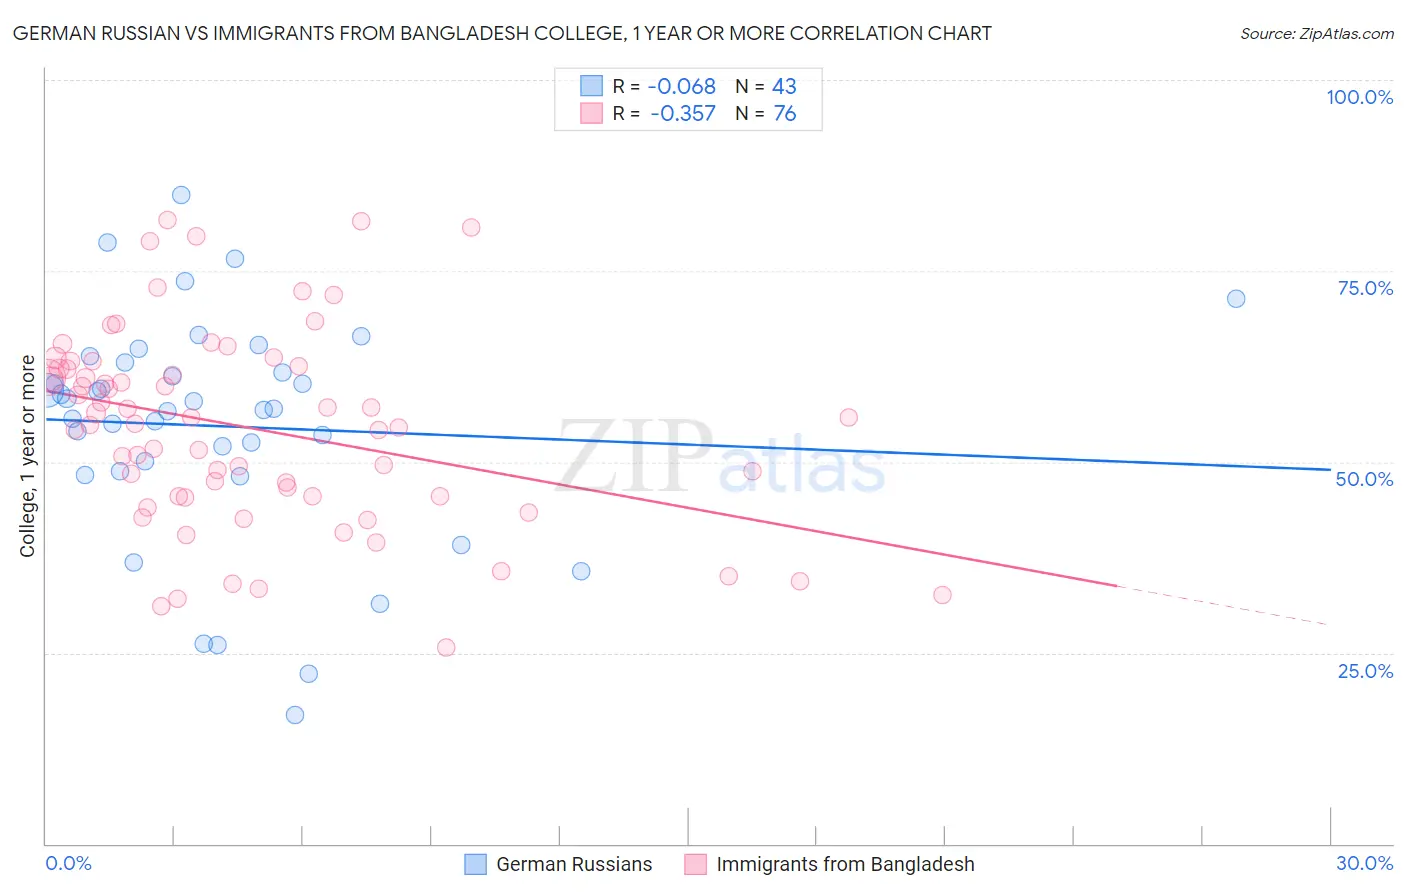
German Russian vs Immigrants from Bangladesh College, 1 year or more Correlation Chart
The statistical analysis conducted on geographies consisting of 96,461,984 people shows a slight negative correlation between the proportion of German Russians and percentage of population with at least college, 1 year or more education in the United States with a correlation coefficient (R) of -0.068 and weighted average of 59.1%. Similarly, the statistical analysis conducted on geographies consisting of 203,680,191 people shows a mild negative correlation between the proportion of Immigrants from Bangladesh and percentage of population with at least college, 1 year or more education in the United States with a correlation coefficient (R) of -0.357 and weighted average of 56.6%, a difference of 4.4%.
College, 1 year or more Correlation Summary
| Measurement | German Russian | Immigrants from Bangladesh |
| Minimum | 16.9% | 25.6% |
| Maximum | 84.9% | 81.7% |
| Range | 68.0% | 56.1% |
| Mean | 54.7% | 54.4% |
| Median | 57.0% | 55.4% |
| Interquartile 25% (IQ1) | 48.8% | 45.5% |
| Interquartile 75% (IQ3) | 63.0% | 62.4% |
| Interquartile Range (IQR) | 14.2% | 16.9% |
| Standard Deviation (Sample) | 14.9% | 12.9% |
| Standard Deviation (Population) | 14.7% | 12.8% |
Similar Demographics by College, 1 year or more
Demographics Similar to German Russians by College, 1 year or more
In terms of college, 1 year or more, the demographic groups most similar to German Russians are Spaniard (59.0%, a difference of 0.060%), Immigrants from Bosnia and Herzegovina (59.2%, a difference of 0.19%), South American (59.0%, a difference of 0.20%), Swiss (59.2%, a difference of 0.22%), and Yugoslavian (59.2%, a difference of 0.26%).
| Demographics | Rating | Rank | College, 1 year or more |
| Immigrants | Poland | 48.9 /100 | #176 | Average 59.4% |
| Tlingit-Haida | 48.4 /100 | #177 | Average 59.4% |
| Czechoslovakians | 48.3 /100 | #178 | Average 59.4% |
| Bermudans | 46.6 /100 | #179 | Average 59.3% |
| Yugoslavians | 44.1 /100 | #180 | Average 59.2% |
| Swiss | 43.4 /100 | #181 | Average 59.2% |
| Immigrants | Bosnia and Herzegovina | 42.8 /100 | #182 | Average 59.2% |
| German Russians | 39.3 /100 | #183 | Fair 59.1% |
| Spaniards | 38.3 /100 | #184 | Fair 59.0% |
| South Americans | 35.9 /100 | #185 | Fair 59.0% |
| Scotch-Irish | 34.7 /100 | #186 | Fair 58.9% |
| Germans | 34.7 /100 | #187 | Fair 58.9% |
| French | 34.4 /100 | #188 | Fair 58.9% |
| Uruguayans | 31.8 /100 | #189 | Fair 58.8% |
| Immigrants | Cameroon | 31.2 /100 | #190 | Fair 58.8% |
Demographics Similar to Immigrants from Bangladesh by College, 1 year or more
In terms of college, 1 year or more, the demographic groups most similar to Immigrants from Bangladesh are Immigrants from Burma/Myanmar (56.6%, a difference of 0.060%), Nonimmigrants (56.5%, a difference of 0.090%), Liberian (56.7%, a difference of 0.25%), Cree (56.8%, a difference of 0.47%), and Spanish American (56.3%, a difference of 0.54%).
| Demographics | Rating | Rank | College, 1 year or more |
| Vietnamese | 4.7 /100 | #225 | Tragic 57.0% |
| Immigrants | Western Africa | 4.6 /100 | #226 | Tragic 57.0% |
| Immigrants | Immigrants | 4.4 /100 | #227 | Tragic 57.0% |
| Immigrants | Fiji | 4.0 /100 | #228 | Tragic 56.9% |
| Cree | 3.6 /100 | #229 | Tragic 56.8% |
| Liberians | 3.1 /100 | #230 | Tragic 56.7% |
| Immigrants | Burma/Myanmar | 2.7 /100 | #231 | Tragic 56.6% |
| Immigrants | Bangladesh | 2.6 /100 | #232 | Tragic 56.6% |
| Immigrants | Nonimmigrants | 2.5 /100 | #233 | Tragic 56.5% |
| Spanish Americans | 1.8 /100 | #234 | Tragic 56.3% |
| West Indians | 1.8 /100 | #235 | Tragic 56.3% |
| Iroquois | 1.7 /100 | #236 | Tragic 56.2% |
| Samoans | 1.6 /100 | #237 | Tragic 56.2% |
| Barbadians | 1.3 /100 | #238 | Tragic 56.0% |
| Puget Sound Salish | 1.1 /100 | #239 | Tragic 55.9% |