Immigrants from Moldova vs Yakama GED/Equivalency
COMPARE
Immigrants from Moldova
Yakama
GED/Equivalency
GED/Equivalency Comparison
Immigrants from Moldova
Yakama
87.7%
GED/EQUIVALENCY
98.8/ 100
METRIC RATING
72nd/ 347
METRIC RANK
74.5%
GED/EQUIVALENCY
0.0/ 100
METRIC RATING
347th/ 347
METRIC RANK
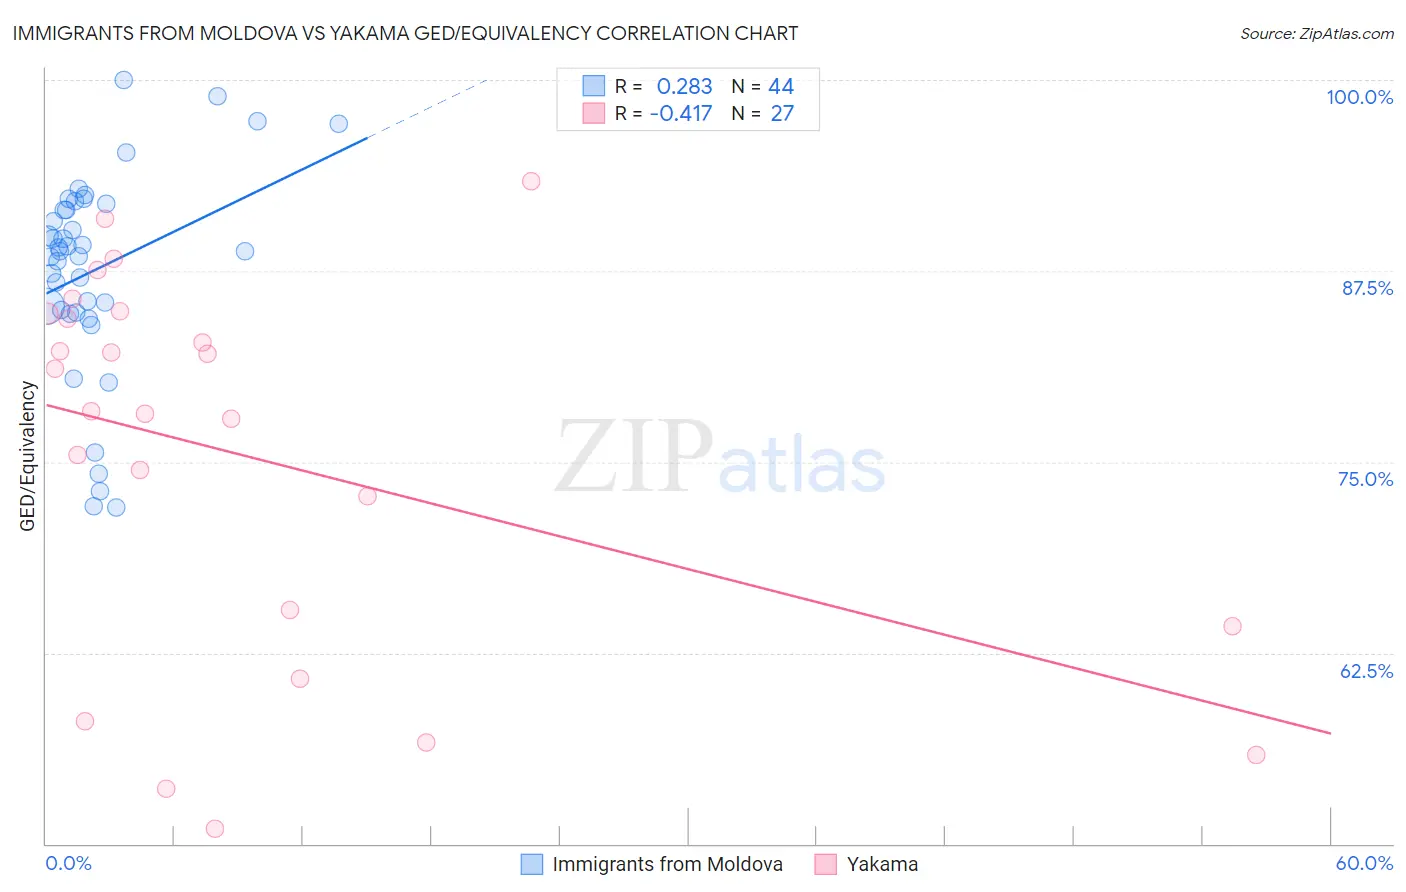
Immigrants from Moldova vs Yakama GED/Equivalency Correlation Chart
The statistical analysis conducted on geographies consisting of 124,401,069 people shows a weak positive correlation between the proportion of Immigrants from Moldova and percentage of population with at least ged/equivalency education in the United States with a correlation coefficient (R) of 0.283 and weighted average of 87.7%. Similarly, the statistical analysis conducted on geographies consisting of 19,923,144 people shows a moderate negative correlation between the proportion of Yakama and percentage of population with at least ged/equivalency education in the United States with a correlation coefficient (R) of -0.417 and weighted average of 74.5%, a difference of 17.7%.
GED/Equivalency Correlation Summary
| Measurement | Immigrants from Moldova | Yakama |
| Minimum | 72.0% | 51.0% |
| Maximum | 100.0% | 93.3% |
| Range | 28.0% | 42.4% |
| Mean | 87.6% | 75.3% |
| Median | 88.8% | 78.4% |
| Interquartile 25% (IQ1) | 84.9% | 64.2% |
| Interquartile 75% (IQ3) | 91.7% | 84.7% |
| Interquartile Range (IQR) | 6.8% | 20.4% |
| Standard Deviation (Sample) | 6.7% | 12.5% |
| Standard Deviation (Population) | 6.6% | 12.2% |
Similar Demographics by GED/Equivalency
Demographics Similar to Immigrants from Moldova by GED/Equivalency
In terms of ged/equivalency, the demographic groups most similar to Immigrants from Moldova are Ukrainian (87.7%, a difference of 0.0%), Austrian (87.7%, a difference of 0.0%), Belgian (87.7%, a difference of 0.010%), Immigrants from Kuwait (87.7%, a difference of 0.030%), and Immigrants from Saudi Arabia (87.8%, a difference of 0.050%).
| Demographics | Rating | Rank | GED/Equivalency |
| Immigrants | North America | 99.1 /100 | #65 | Exceptional 87.8% |
| Immigrants | Bulgaria | 99.1 /100 | #66 | Exceptional 87.8% |
| British | 99.1 /100 | #67 | Exceptional 87.8% |
| Immigrants | France | 99.1 /100 | #68 | Exceptional 87.8% |
| Immigrants | Saudi Arabia | 99.0 /100 | #69 | Exceptional 87.8% |
| Ukrainians | 98.8 /100 | #70 | Exceptional 87.7% |
| Austrians | 98.8 /100 | #71 | Exceptional 87.7% |
| Immigrants | Moldova | 98.8 /100 | #72 | Exceptional 87.7% |
| Belgians | 98.8 /100 | #73 | Exceptional 87.7% |
| Immigrants | Kuwait | 98.8 /100 | #74 | Exceptional 87.7% |
| Scottish | 98.7 /100 | #75 | Exceptional 87.7% |
| Immigrants | Serbia | 98.7 /100 | #76 | Exceptional 87.7% |
| Slavs | 98.7 /100 | #77 | Exceptional 87.7% |
| Irish | 98.6 /100 | #78 | Exceptional 87.6% |
| English | 98.6 /100 | #79 | Exceptional 87.6% |
Demographics Similar to Yakama by GED/Equivalency
In terms of ged/equivalency, the demographic groups most similar to Yakama are Houma (75.0%, a difference of 0.61%), Immigrants from Mexico (75.7%, a difference of 1.6%), Spanish American Indian (76.3%, a difference of 2.5%), Immigrants from Central America (76.4%, a difference of 2.5%), and Pima (76.4%, a difference of 2.6%).
| Demographics | Rating | Rank | GED/Equivalency |
| Salvadorans | 0.0 /100 | #333 | Tragic 78.6% |
| Guatemalans | 0.0 /100 | #334 | Tragic 78.5% |
| Immigrants | Latin America | 0.0 /100 | #335 | Tragic 78.5% |
| Immigrants | Dominican Republic | 0.0 /100 | #336 | Tragic 78.0% |
| Immigrants | Yemen | 0.0 /100 | #337 | Tragic 77.9% |
| Immigrants | Guatemala | 0.0 /100 | #338 | Tragic 77.9% |
| Immigrants | El Salvador | 0.0 /100 | #339 | Tragic 77.6% |
| Tohono O'odham | 0.0 /100 | #340 | Tragic 77.5% |
| Mexicans | 0.0 /100 | #341 | Tragic 77.4% |
| Pima | 0.0 /100 | #342 | Tragic 76.4% |
| Immigrants | Central America | 0.0 /100 | #343 | Tragic 76.4% |
| Spanish American Indians | 0.0 /100 | #344 | Tragic 76.3% |
| Immigrants | Mexico | 0.0 /100 | #345 | Tragic 75.7% |
| Houma | 0.0 /100 | #346 | Tragic 75.0% |
| Yakama | 0.0 /100 | #347 | Tragic 74.5% |