Immigrants from Peru vs Spanish Master's Degree
COMPARE
Immigrants from Peru
Spanish
Master's Degree
Master's Degree Comparison
Immigrants from Peru
Spanish
14.9%
MASTER'S DEGREE
49.6/ 100
METRIC RATING
175th/ 347
METRIC RANK
14.2%
MASTER'S DEGREE
17.8/ 100
METRIC RATING
212th/ 347
METRIC RANK
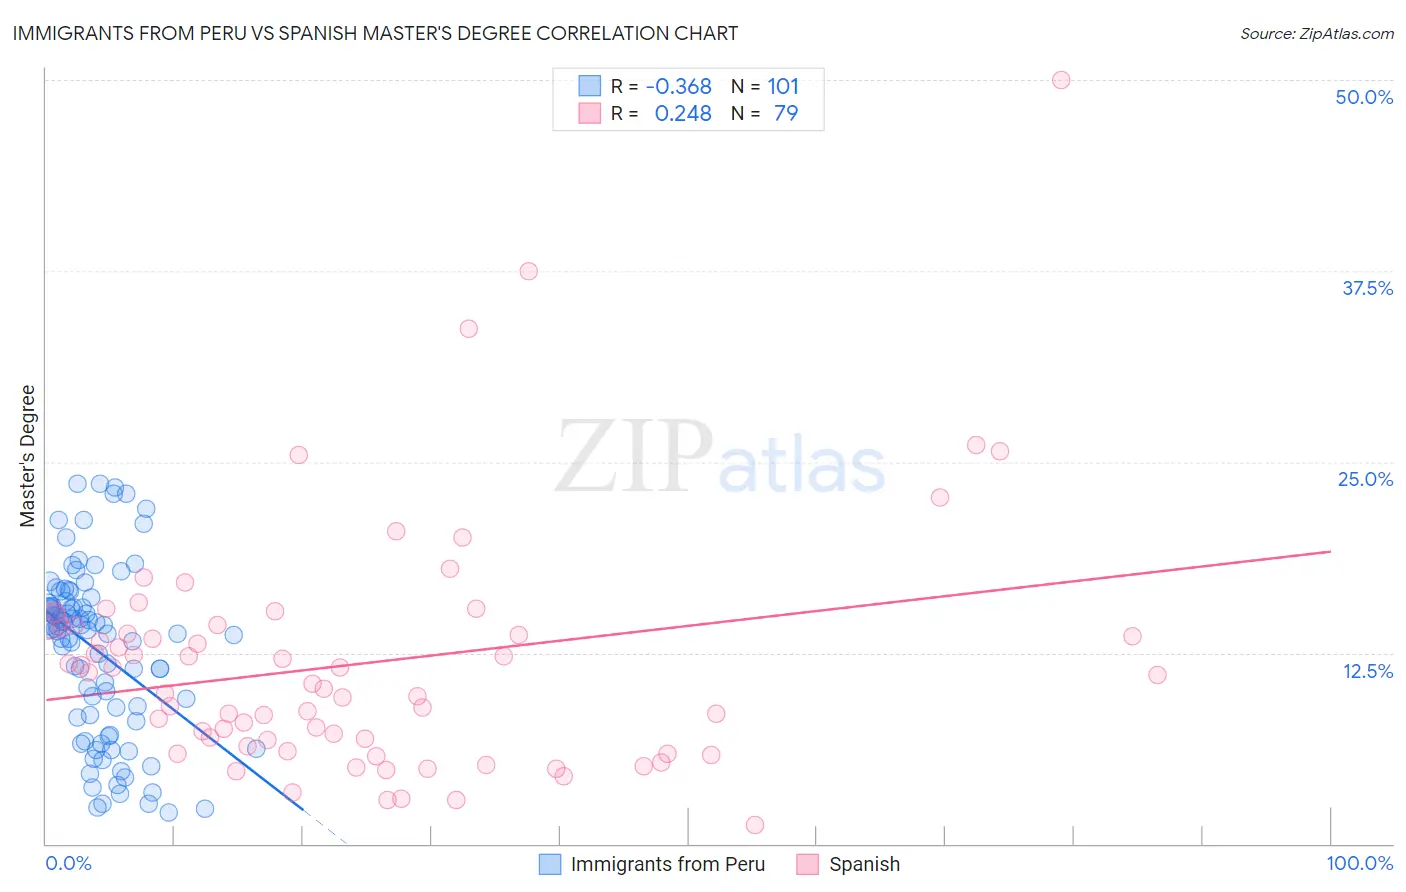
Immigrants from Peru vs Spanish Master's Degree Correlation Chart
The statistical analysis conducted on geographies consisting of 328,828,935 people shows a mild negative correlation between the proportion of Immigrants from Peru and percentage of population with at least master's degree education in the United States with a correlation coefficient (R) of -0.368 and weighted average of 14.9%. Similarly, the statistical analysis conducted on geographies consisting of 421,994,419 people shows a weak positive correlation between the proportion of Spanish and percentage of population with at least master's degree education in the United States with a correlation coefficient (R) of 0.248 and weighted average of 14.2%, a difference of 5.1%.
Master's Degree Correlation Summary
| Measurement | Immigrants from Peru | Spanish |
| Minimum | 2.1% | 1.2% |
| Maximum | 23.6% | 50.0% |
| Range | 21.5% | 48.8% |
| Mean | 12.6% | 11.8% |
| Median | 14.0% | 10.5% |
| Interquartile 25% (IQ1) | 8.2% | 6.4% |
| Interquartile 75% (IQ3) | 15.8% | 14.3% |
| Interquartile Range (IQR) | 7.6% | 7.9% |
| Standard Deviation (Sample) | 5.5% | 8.0% |
| Standard Deviation (Population) | 5.5% | 7.9% |
Similar Demographics by Master's Degree
Demographics Similar to Immigrants from Peru by Master's Degree
In terms of master's degree, the demographic groups most similar to Immigrants from Peru are Slovak (14.9%, a difference of 0.050%), Nigerian (14.9%, a difference of 0.14%), Immigrants from Colombia (14.9%, a difference of 0.17%), Costa Rican (15.0%, a difference of 0.36%), and Immigrants from Uruguay (15.0%, a difference of 0.40%).
| Demographics | Rating | Rank | Master's Degree |
| Immigrants | North Macedonia | 64.5 /100 | #168 | Good 15.2% |
| Scottish | 62.7 /100 | #169 | Good 15.2% |
| Irish | 56.3 /100 | #170 | Average 15.0% |
| Immigrants | Ghana | 53.6 /100 | #171 | Average 15.0% |
| Immigrants | Uruguay | 52.8 /100 | #172 | Average 15.0% |
| Costa Ricans | 52.5 /100 | #173 | Average 15.0% |
| Slovaks | 50.0 /100 | #174 | Average 14.9% |
| Immigrants | Peru | 49.6 /100 | #175 | Average 14.9% |
| Nigerians | 48.6 /100 | #176 | Average 14.9% |
| Immigrants | Colombia | 48.3 /100 | #177 | Average 14.9% |
| English | 45.0 /100 | #178 | Average 14.8% |
| Immigrants | Iraq | 41.3 /100 | #179 | Average 14.8% |
| Celtics | 41.3 /100 | #180 | Average 14.8% |
| Swiss | 41.1 /100 | #181 | Average 14.7% |
| Czechs | 40.4 /100 | #182 | Average 14.7% |
Demographics Similar to Spanish by Master's Degree
In terms of master's degree, the demographic groups most similar to Spanish are Somali (14.2%, a difference of 0.050%), Immigrants from Thailand (14.2%, a difference of 0.19%), Finnish (14.2%, a difference of 0.20%), Subsaharan African (14.2%, a difference of 0.36%), and Immigrants from Vietnam (14.1%, a difference of 0.41%).
| Demographics | Rating | Rank | Master's Degree |
| Trinidadians and Tobagonians | 23.5 /100 | #205 | Fair 14.4% |
| Scandinavians | 23.3 /100 | #206 | Fair 14.4% |
| Immigrants | Bosnia and Herzegovina | 22.0 /100 | #207 | Fair 14.3% |
| Immigrants | Barbados | 20.5 /100 | #208 | Fair 14.3% |
| Immigrants | Panama | 20.0 /100 | #209 | Fair 14.3% |
| Sub-Saharan Africans | 19.4 /100 | #210 | Poor 14.2% |
| Somalis | 18.0 /100 | #211 | Poor 14.2% |
| Spanish | 17.8 /100 | #212 | Poor 14.2% |
| Immigrants | Thailand | 17.0 /100 | #213 | Poor 14.2% |
| Finns | 16.9 /100 | #214 | Poor 14.2% |
| Immigrants | Vietnam | 16.1 /100 | #215 | Poor 14.1% |
| Immigrants | Somalia | 15.8 /100 | #216 | Poor 14.1% |
| Immigrants | Trinidad and Tobago | 15.8 /100 | #217 | Poor 14.1% |
| French Canadians | 14.9 /100 | #218 | Poor 14.1% |
| Norwegians | 13.6 /100 | #219 | Poor 14.0% |