Immigrants from Middle Africa vs Immigrants from Nigeria Nursery School
COMPARE
Immigrants from Middle Africa
Immigrants from Nigeria
Nursery School
Nursery School Comparison
Immigrants from Middle Africa
Immigrants from Nigeria
97.6%
NURSERY SCHOOL
0.9/ 100
METRIC RATING
247th/ 347
METRIC RANK
97.5%
NURSERY SCHOOL
0.3/ 100
METRIC RATING
267th/ 347
METRIC RANK
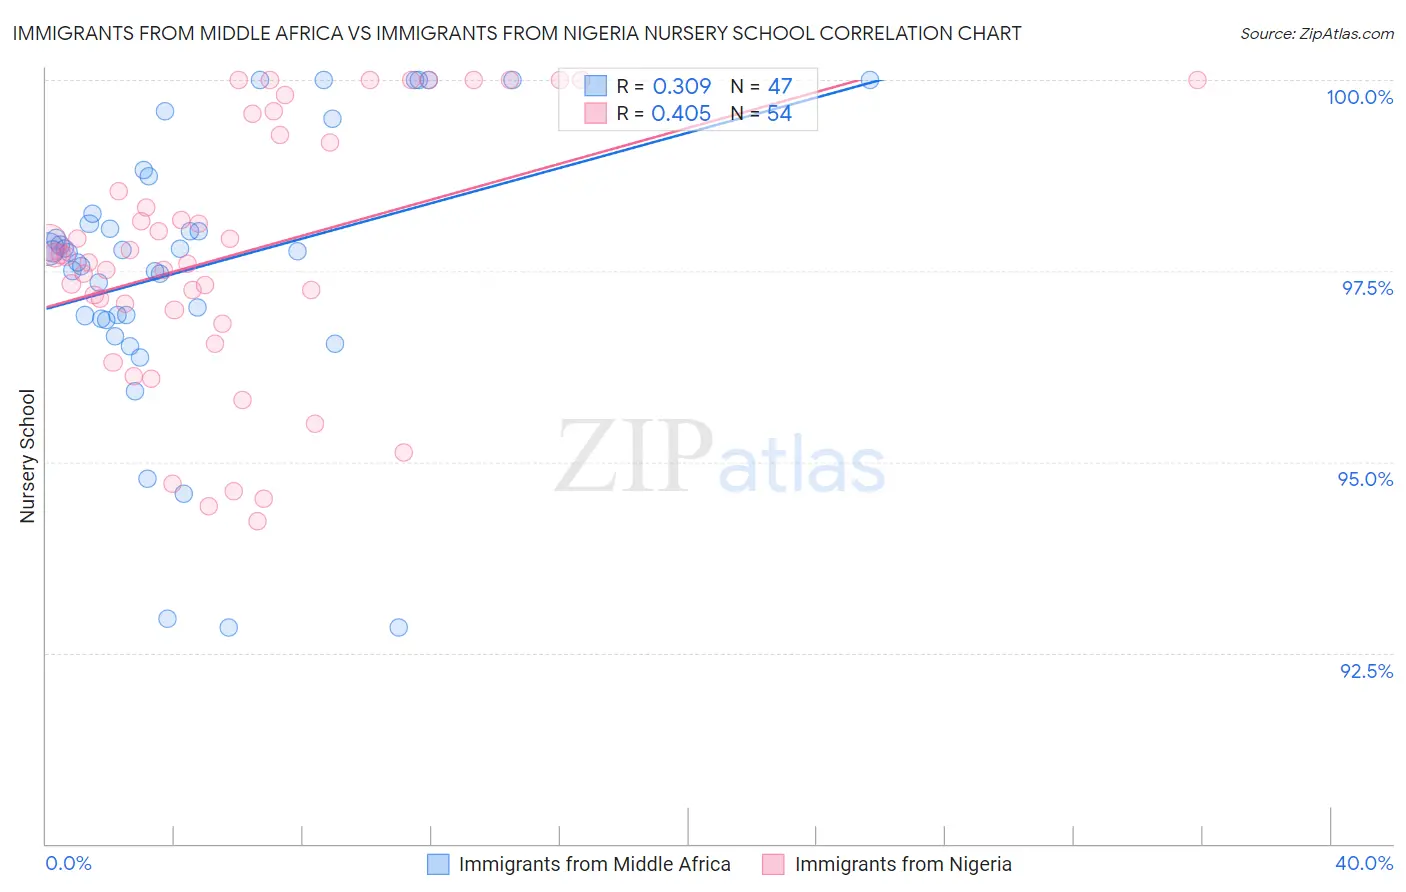
Immigrants from Middle Africa vs Immigrants from Nigeria Nursery School Correlation Chart
The statistical analysis conducted on geographies consisting of 202,721,852 people shows a mild positive correlation between the proportion of Immigrants from Middle Africa and percentage of population with at least nursery school education in the United States with a correlation coefficient (R) of 0.309 and weighted average of 97.6%. Similarly, the statistical analysis conducted on geographies consisting of 283,430,369 people shows a moderate positive correlation between the proportion of Immigrants from Nigeria and percentage of population with at least nursery school education in the United States with a correlation coefficient (R) of 0.405 and weighted average of 97.5%, a difference of 0.090%.
Nursery School Correlation Summary
| Measurement | Immigrants from Middle Africa | Immigrants from Nigeria |
| Minimum | 92.8% | 94.2% |
| Maximum | 100.0% | 100.0% |
| Range | 7.2% | 5.8% |
| Mean | 97.5% | 97.7% |
| Median | 97.8% | 97.7% |
| Interquartile 25% (IQ1) | 96.9% | 97.0% |
| Interquartile 75% (IQ3) | 98.2% | 99.3% |
| Interquartile Range (IQR) | 1.4% | 2.3% |
| Standard Deviation (Sample) | 1.8% | 1.7% |
| Standard Deviation (Population) | 1.8% | 1.7% |
Demographics Similar to Immigrants from Middle Africa and Immigrants from Nigeria by Nursery School
In terms of nursery school, the demographic groups most similar to Immigrants from Middle Africa are Indian (Asian) (97.6%, a difference of 0.0%), Immigrants from Eastern Africa (97.6%, a difference of 0.0%), Immigrants from Senegal (97.6%, a difference of 0.0%), Ethiopian (97.6%, a difference of 0.010%), and Immigrants from Africa (97.6%, a difference of 0.020%). Similarly, the demographic groups most similar to Immigrants from Nigeria are Assyrian/Chaldean/Syriac (97.6%, a difference of 0.010%), Immigrants from Sierra Leone (97.6%, a difference of 0.010%), Immigrants from Ethiopia (97.6%, a difference of 0.020%), Fijian (97.6%, a difference of 0.020%), and Taiwanese (97.6%, a difference of 0.020%).
| Demographics | Rating | Rank | Nursery School |
| Immigrants | Middle Africa | 0.9 /100 | #247 | Tragic 97.6% |
| Indians (Asian) | 0.9 /100 | #248 | Tragic 97.6% |
| Immigrants | Eastern Africa | 0.9 /100 | #249 | Tragic 97.6% |
| Immigrants | Senegal | 0.9 /100 | #250 | Tragic 97.6% |
| Ethiopians | 0.8 /100 | #251 | Tragic 97.6% |
| Immigrants | Africa | 0.8 /100 | #252 | Tragic 97.6% |
| Immigrants | Iraq | 0.7 /100 | #253 | Tragic 97.6% |
| Immigrants | Congo | 0.7 /100 | #254 | Tragic 97.6% |
| Immigrants | Asia | 0.7 /100 | #255 | Tragic 97.6% |
| Yaqui | 0.6 /100 | #256 | Tragic 97.6% |
| Immigrants | Colombia | 0.6 /100 | #257 | Tragic 97.6% |
| Jamaicans | 0.6 /100 | #258 | Tragic 97.6% |
| Armenians | 0.4 /100 | #259 | Tragic 97.6% |
| Immigrants | South America | 0.4 /100 | #260 | Tragic 97.6% |
| Cubans | 0.4 /100 | #261 | Tragic 97.6% |
| Immigrants | Ethiopia | 0.4 /100 | #262 | Tragic 97.6% |
| Fijians | 0.3 /100 | #263 | Tragic 97.6% |
| Taiwanese | 0.3 /100 | #264 | Tragic 97.6% |
| Assyrians/Chaldeans/Syriacs | 0.3 /100 | #265 | Tragic 97.6% |
| Immigrants | Sierra Leone | 0.3 /100 | #266 | Tragic 97.6% |
| Immigrants | Nigeria | 0.3 /100 | #267 | Tragic 97.5% |