German Russian vs Immigrants from Peru Master's Degree
COMPARE
German Russian
Immigrants from Peru
Master's Degree
Master's Degree Comparison
German Russians
Immigrants from Peru
13.5%
MASTER'S DEGREE
4.5/ 100
METRIC RATING
235th/ 347
METRIC RANK
14.9%
MASTER'S DEGREE
49.6/ 100
METRIC RATING
175th/ 347
METRIC RANK
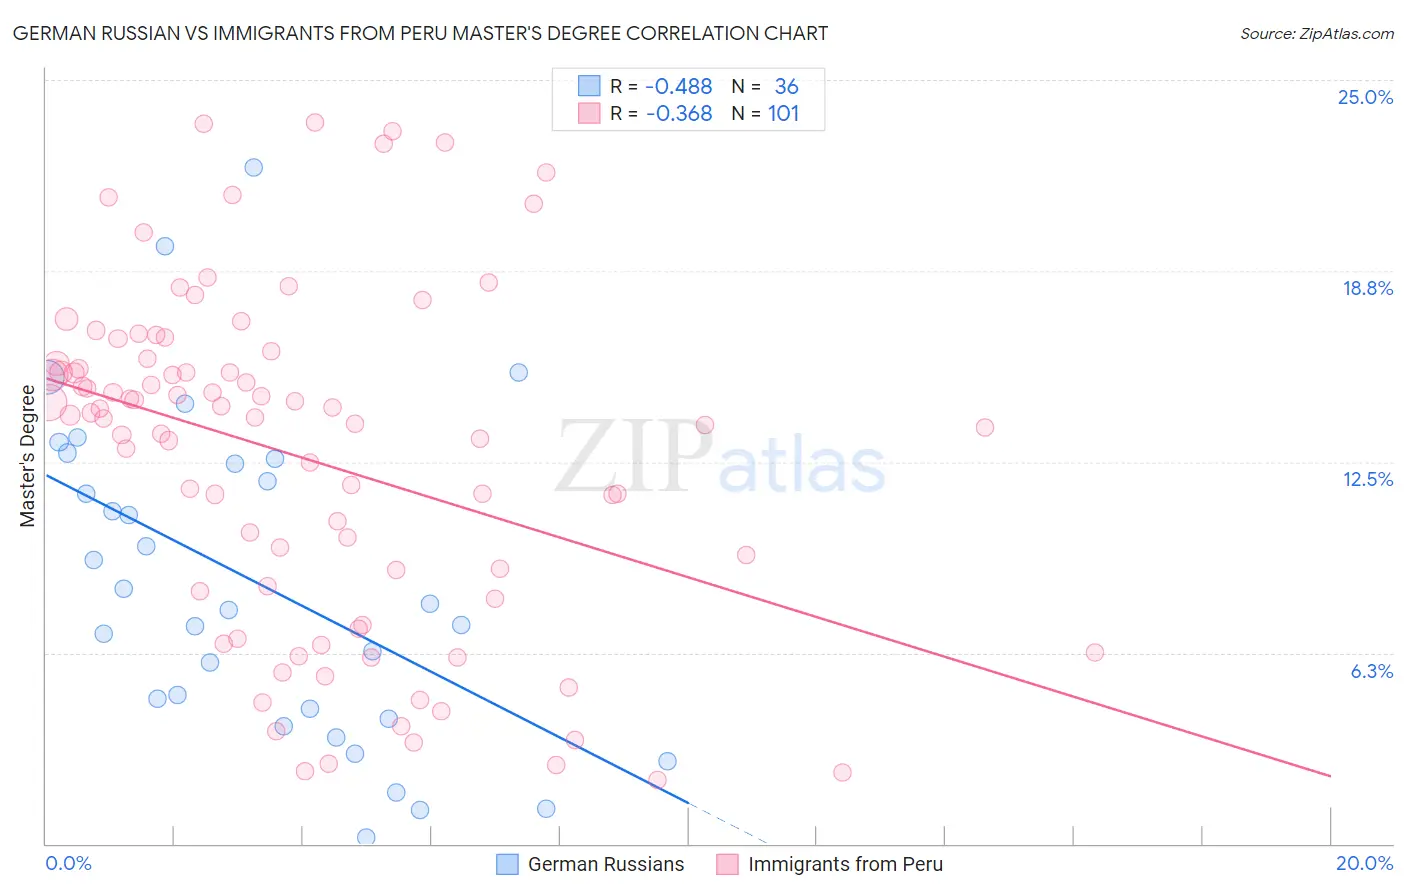
German Russian vs Immigrants from Peru Master's Degree Correlation Chart
The statistical analysis conducted on geographies consisting of 96,446,864 people shows a moderate negative correlation between the proportion of German Russians and percentage of population with at least master's degree education in the United States with a correlation coefficient (R) of -0.488 and weighted average of 13.5%. Similarly, the statistical analysis conducted on geographies consisting of 328,828,935 people shows a mild negative correlation between the proportion of Immigrants from Peru and percentage of population with at least master's degree education in the United States with a correlation coefficient (R) of -0.368 and weighted average of 14.9%, a difference of 10.8%.
Master's Degree Correlation Summary
| Measurement | German Russian | Immigrants from Peru |
| Minimum | 0.22% | 2.1% |
| Maximum | 22.1% | 23.6% |
| Range | 21.9% | 21.5% |
| Mean | 8.5% | 12.6% |
| Median | 7.8% | 14.0% |
| Interquartile 25% (IQ1) | 4.3% | 8.2% |
| Interquartile 75% (IQ3) | 12.5% | 15.8% |
| Interquartile Range (IQR) | 8.3% | 7.6% |
| Standard Deviation (Sample) | 5.3% | 5.5% |
| Standard Deviation (Population) | 5.2% | 5.5% |
Similar Demographics by Master's Degree
Demographics Similar to German Russians by Master's Degree
In terms of master's degree, the demographic groups most similar to German Russians are Immigrants from Guyana (13.4%, a difference of 0.11%), Jamaican (13.4%, a difference of 0.34%), Immigrants from Burma/Myanmar (13.5%, a difference of 0.41%), Hmong (13.4%, a difference of 0.48%), and Immigrants from Ecuador (13.6%, a difference of 0.91%).
| Demographics | Rating | Rank | Master's Degree |
| Whites/Caucasians | 9.1 /100 | #228 | Tragic 13.8% |
| British West Indians | 8.8 /100 | #229 | Tragic 13.8% |
| Dutch | 8.7 /100 | #230 | Tragic 13.8% |
| Guyanese | 7.6 /100 | #231 | Tragic 13.7% |
| Immigrants | Philippines | 6.0 /100 | #232 | Tragic 13.6% |
| Immigrants | Ecuador | 5.7 /100 | #233 | Tragic 13.6% |
| Immigrants | Burma/Myanmar | 5.0 /100 | #234 | Tragic 13.5% |
| German Russians | 4.5 /100 | #235 | Tragic 13.5% |
| Immigrants | Guyana | 4.4 /100 | #236 | Tragic 13.4% |
| Jamaicans | 4.1 /100 | #237 | Tragic 13.4% |
| Hmong | 4.0 /100 | #238 | Tragic 13.4% |
| Immigrants | Nonimmigrants | 3.4 /100 | #239 | Tragic 13.3% |
| Guamanians/Chamorros | 2.2 /100 | #240 | Tragic 13.1% |
| U.S. Virgin Islanders | 2.1 /100 | #241 | Tragic 13.1% |
| Spanish Americans | 1.9 /100 | #242 | Tragic 13.0% |
Demographics Similar to Immigrants from Peru by Master's Degree
In terms of master's degree, the demographic groups most similar to Immigrants from Peru are Slovak (14.9%, a difference of 0.050%), Nigerian (14.9%, a difference of 0.14%), Immigrants from Colombia (14.9%, a difference of 0.17%), Costa Rican (15.0%, a difference of 0.36%), and Immigrants from Uruguay (15.0%, a difference of 0.40%).
| Demographics | Rating | Rank | Master's Degree |
| Immigrants | North Macedonia | 64.5 /100 | #168 | Good 15.2% |
| Scottish | 62.7 /100 | #169 | Good 15.2% |
| Irish | 56.3 /100 | #170 | Average 15.0% |
| Immigrants | Ghana | 53.6 /100 | #171 | Average 15.0% |
| Immigrants | Uruguay | 52.8 /100 | #172 | Average 15.0% |
| Costa Ricans | 52.5 /100 | #173 | Average 15.0% |
| Slovaks | 50.0 /100 | #174 | Average 14.9% |
| Immigrants | Peru | 49.6 /100 | #175 | Average 14.9% |
| Nigerians | 48.6 /100 | #176 | Average 14.9% |
| Immigrants | Colombia | 48.3 /100 | #177 | Average 14.9% |
| English | 45.0 /100 | #178 | Average 14.8% |
| Immigrants | Iraq | 41.3 /100 | #179 | Average 14.8% |
| Celtics | 41.3 /100 | #180 | Average 14.8% |
| Swiss | 41.1 /100 | #181 | Average 14.7% |
| Czechs | 40.4 /100 | #182 | Average 14.7% |