Immigrants from Micronesia vs Native Hawaiian College, 1 year or more
COMPARE
Immigrants from Micronesia
Native Hawaiian
College, 1 year or more
College, 1 year or more Comparison
Immigrants from Micronesia
Native Hawaiians
54.8%
COLLEGE, 1 YEAR OR MORE
0.3/ 100
METRIC RATING
264th/ 347
METRIC RANK
57.6%
COLLEGE, 1 YEAR OR MORE
9.0/ 100
METRIC RATING
218th/ 347
METRIC RANK
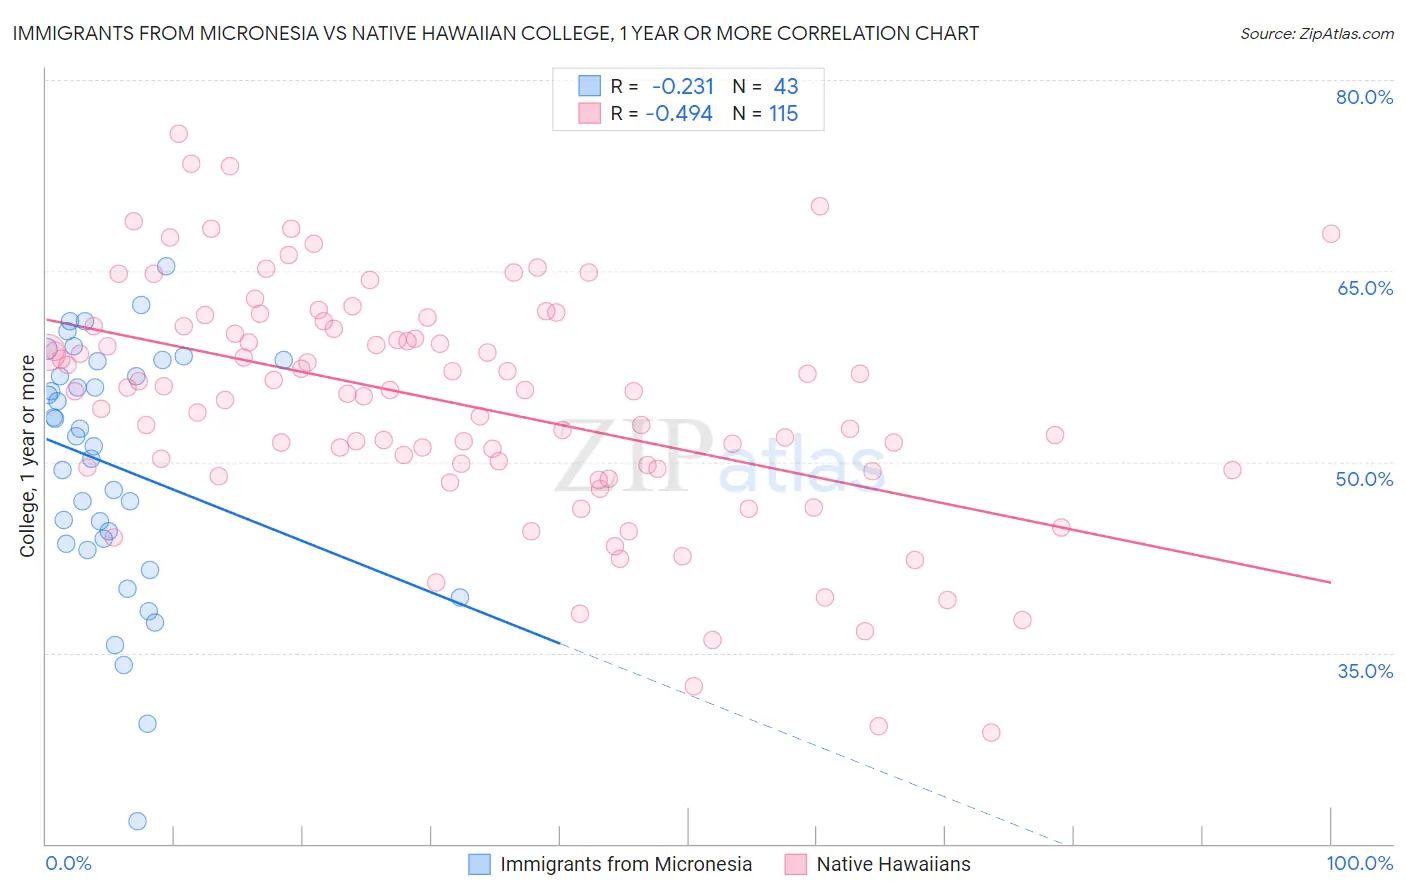
Immigrants from Micronesia vs Native Hawaiian College, 1 year or more Correlation Chart
The statistical analysis conducted on geographies consisting of 61,608,832 people shows a weak negative correlation between the proportion of Immigrants from Micronesia and percentage of population with at least college, 1 year or more education in the United States with a correlation coefficient (R) of -0.231 and weighted average of 54.8%. Similarly, the statistical analysis conducted on geographies consisting of 332,118,930 people shows a moderate negative correlation between the proportion of Native Hawaiians and percentage of population with at least college, 1 year or more education in the United States with a correlation coefficient (R) of -0.494 and weighted average of 57.6%, a difference of 5.1%.
College, 1 year or more Correlation Summary
| Measurement | Immigrants from Micronesia | Native Hawaiian |
| Minimum | 21.8% | 28.7% |
| Maximum | 65.3% | 75.7% |
| Range | 43.6% | 47.0% |
| Mean | 49.7% | 54.6% |
| Median | 52.0% | 55.5% |
| Interquartile 25% (IQ1) | 43.6% | 49.5% |
| Interquartile 75% (IQ3) | 57.9% | 60.7% |
| Interquartile Range (IQR) | 14.3% | 11.2% |
| Standard Deviation (Sample) | 9.7% | 9.2% |
| Standard Deviation (Population) | 9.5% | 9.2% |
Similar Demographics by College, 1 year or more
Demographics Similar to Immigrants from Micronesia by College, 1 year or more
In terms of college, 1 year or more, the demographic groups most similar to Immigrants from Micronesia are U.S. Virgin Islander (54.8%, a difference of 0.020%), Immigrants from St. Vincent and the Grenadines (54.8%, a difference of 0.050%), Ottawa (54.9%, a difference of 0.13%), Jamaican (54.9%, a difference of 0.16%), and Immigrants from Laos (54.7%, a difference of 0.19%).
| Demographics | Rating | Rank | College, 1 year or more |
| Indonesians | 0.4 /100 | #257 | Tragic 55.1% |
| Africans | 0.4 /100 | #258 | Tragic 55.0% |
| Nepalese | 0.3 /100 | #259 | Tragic 54.9% |
| Jamaicans | 0.3 /100 | #260 | Tragic 54.9% |
| Ottawa | 0.3 /100 | #261 | Tragic 54.9% |
| Immigrants | St. Vincent and the Grenadines | 0.3 /100 | #262 | Tragic 54.8% |
| U.S. Virgin Islanders | 0.3 /100 | #263 | Tragic 54.8% |
| Immigrants | Micronesia | 0.3 /100 | #264 | Tragic 54.8% |
| Immigrants | Laos | 0.2 /100 | #265 | Tragic 54.7% |
| Potawatomi | 0.2 /100 | #266 | Tragic 54.6% |
| Blackfeet | 0.2 /100 | #267 | Tragic 54.6% |
| British West Indians | 0.2 /100 | #268 | Tragic 54.5% |
| Bangladeshis | 0.2 /100 | #269 | Tragic 54.5% |
| Crow | 0.2 /100 | #270 | Tragic 54.5% |
| Bahamians | 0.2 /100 | #271 | Tragic 54.5% |
Demographics Similar to Native Hawaiians by College, 1 year or more
In terms of college, 1 year or more, the demographic groups most similar to Native Hawaiians are Immigrants from Panama (57.6%, a difference of 0.0%), White/Caucasian (57.6%, a difference of 0.060%), Immigrants from Costa Rica (57.5%, a difference of 0.18%), Immigrants from Peru (57.7%, a difference of 0.24%), and Immigrants from Ghana (57.4%, a difference of 0.25%).
| Demographics | Rating | Rank | College, 1 year or more |
| Immigrants | Nigeria | 13.3 /100 | #211 | Poor 57.9% |
| Immigrants | Senegal | 11.8 /100 | #212 | Poor 57.8% |
| French Canadians | 11.8 /100 | #213 | Poor 57.8% |
| Immigrants | Colombia | 11.6 /100 | #214 | Poor 57.8% |
| Tongans | 11.6 /100 | #215 | Poor 57.8% |
| Immigrants | Peru | 10.6 /100 | #216 | Poor 57.7% |
| Immigrants | Panama | 9.1 /100 | #217 | Tragic 57.6% |
| Native Hawaiians | 9.0 /100 | #218 | Tragic 57.6% |
| Whites/Caucasians | 8.7 /100 | #219 | Tragic 57.6% |
| Immigrants | Costa Rica | 8.0 /100 | #220 | Tragic 57.5% |
| Immigrants | Ghana | 7.7 /100 | #221 | Tragic 57.4% |
| Sub-Saharan Africans | 6.1 /100 | #222 | Tragic 57.3% |
| Portuguese | 5.4 /100 | #223 | Tragic 57.2% |
| Hmong | 5.4 /100 | #224 | Tragic 57.2% |
| Vietnamese | 4.7 /100 | #225 | Tragic 57.0% |