Immigrants from Mexico vs Estonian 10th Grade
COMPARE
Immigrants from Mexico
Estonian
10th Grade
10th Grade Comparison
Immigrants from Mexico
Estonians
86.2%
10TH GRADE
0.0/ 100
METRIC RATING
347th/ 347
METRIC RANK
95.3%
10TH GRADE
99.9/ 100
METRIC RATING
35th/ 347
METRIC RANK
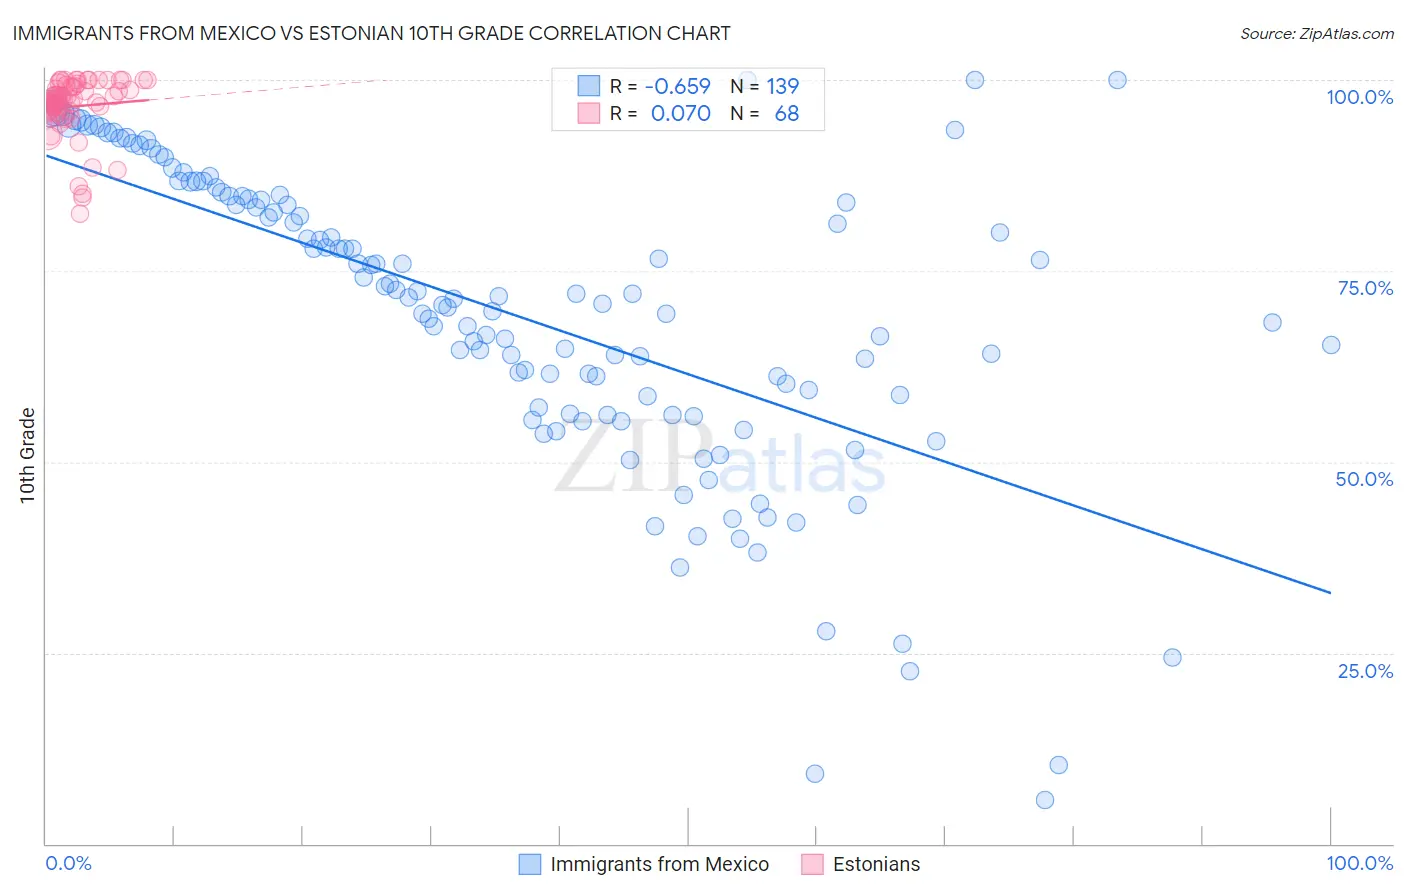
Immigrants from Mexico vs Estonian 10th Grade Correlation Chart
The statistical analysis conducted on geographies consisting of 513,766,684 people shows a significant negative correlation between the proportion of Immigrants from Mexico and percentage of population with at least 10th grade education in the United States with a correlation coefficient (R) of -0.659 and weighted average of 86.2%. Similarly, the statistical analysis conducted on geographies consisting of 123,528,404 people shows a slight positive correlation between the proportion of Estonians and percentage of population with at least 10th grade education in the United States with a correlation coefficient (R) of 0.070 and weighted average of 95.3%, a difference of 10.6%.
10th Grade Correlation Summary
| Measurement | Immigrants from Mexico | Estonian |
| Minimum | 5.7% | 82.5% |
| Maximum | 100.0% | 100.0% |
| Range | 94.3% | 17.5% |
| Mean | 69.4% | 96.5% |
| Median | 71.5% | 97.5% |
| Interquartile 25% (IQ1) | 57.2% | 95.9% |
| Interquartile 75% (IQ3) | 84.8% | 99.2% |
| Interquartile Range (IQR) | 27.6% | 3.3% |
| Standard Deviation (Sample) | 19.7% | 3.9% |
| Standard Deviation (Population) | 19.7% | 3.9% |
Similar Demographics by 10th Grade
Demographics Similar to Immigrants from Mexico by 10th Grade
In terms of 10th grade, the demographic groups most similar to Immigrants from Mexico are Spanish American Indian (86.2%, a difference of 0.010%), Immigrants from Central America (86.6%, a difference of 0.47%), Immigrants from El Salvador (86.8%, a difference of 0.65%), Yakama (86.9%, a difference of 0.78%), and Immigrants from Guatemala (87.4%, a difference of 1.4%).
| Demographics | Rating | Rank | 10th Grade |
| Hondurans | 0.0 /100 | #333 | Tragic 89.0% |
| Hispanics or Latinos | 0.0 /100 | #334 | Tragic 88.9% |
| Immigrants | Dominican Republic | 0.0 /100 | #335 | Tragic 88.7% |
| Immigrants | Honduras | 0.0 /100 | #336 | Tragic 88.5% |
| Central Americans | 0.0 /100 | #337 | Tragic 88.4% |
| Immigrants | Latin America | 0.0 /100 | #338 | Tragic 88.3% |
| Guatemalans | 0.0 /100 | #339 | Tragic 87.9% |
| Mexicans | 0.0 /100 | #340 | Tragic 87.8% |
| Salvadorans | 0.0 /100 | #341 | Tragic 87.5% |
| Immigrants | Guatemala | 0.0 /100 | #342 | Tragic 87.4% |
| Yakama | 0.0 /100 | #343 | Tragic 86.9% |
| Immigrants | El Salvador | 0.0 /100 | #344 | Tragic 86.8% |
| Immigrants | Central America | 0.0 /100 | #345 | Tragic 86.6% |
| Spanish American Indians | 0.0 /100 | #346 | Tragic 86.2% |
| Immigrants | Mexico | 0.0 /100 | #347 | Tragic 86.2% |
Demographics Similar to Estonians by 10th Grade
In terms of 10th grade, the demographic groups most similar to Estonians are British (95.3%, a difference of 0.010%), Immigrants from India (95.3%, a difference of 0.010%), Iranian (95.3%, a difference of 0.020%), Hungarian (95.3%, a difference of 0.020%), and French (95.3%, a difference of 0.020%).
| Demographics | Rating | Rank | 10th Grade |
| Luxembourgers | 100.0 /100 | #28 | Exceptional 95.4% |
| Bulgarians | 100.0 /100 | #29 | Exceptional 95.4% |
| Belgians | 100.0 /100 | #30 | Exceptional 95.4% |
| Iranians | 100.0 /100 | #31 | Exceptional 95.3% |
| Hungarians | 100.0 /100 | #32 | Exceptional 95.3% |
| French | 100.0 /100 | #33 | Exceptional 95.3% |
| British | 99.9 /100 | #34 | Exceptional 95.3% |
| Estonians | 99.9 /100 | #35 | Exceptional 95.3% |
| Immigrants | India | 99.9 /100 | #36 | Exceptional 95.3% |
| French Canadians | 99.9 /100 | #37 | Exceptional 95.3% |
| Northern Europeans | 99.9 /100 | #38 | Exceptional 95.3% |
| Immigrants | Scotland | 99.9 /100 | #39 | Exceptional 95.2% |
| Scotch-Irish | 99.9 /100 | #40 | Exceptional 95.2% |
| Russians | 99.9 /100 | #41 | Exceptional 95.2% |
| Slavs | 99.9 /100 | #42 | Exceptional 95.2% |