Immigrants from Mexico vs Celtic 10th Grade
COMPARE
Immigrants from Mexico
Celtic
10th Grade
10th Grade Comparison
Immigrants from Mexico
Celtics
86.2%
10TH GRADE
0.0/ 100
METRIC RATING
347th/ 347
METRIC RANK
95.0%
10TH GRADE
99.8/ 100
METRIC RATING
59th/ 347
METRIC RANK
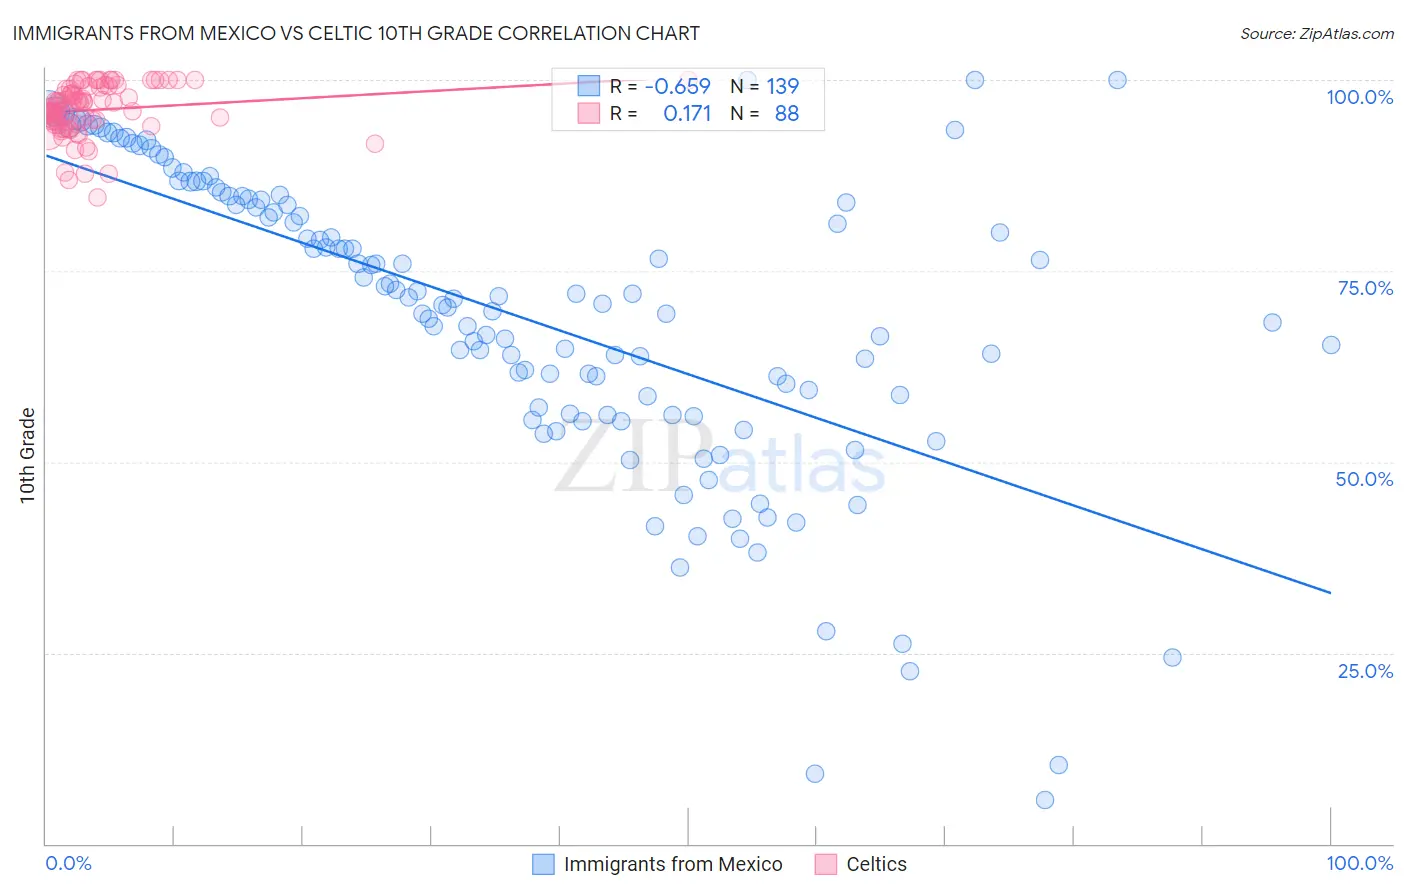
Immigrants from Mexico vs Celtic 10th Grade Correlation Chart
The statistical analysis conducted on geographies consisting of 513,766,684 people shows a significant negative correlation between the proportion of Immigrants from Mexico and percentage of population with at least 10th grade education in the United States with a correlation coefficient (R) of -0.659 and weighted average of 86.2%. Similarly, the statistical analysis conducted on geographies consisting of 168,876,981 people shows a poor positive correlation between the proportion of Celtics and percentage of population with at least 10th grade education in the United States with a correlation coefficient (R) of 0.171 and weighted average of 95.0%, a difference of 10.2%.
10th Grade Correlation Summary
| Measurement | Immigrants from Mexico | Celtic |
| Minimum | 5.7% | 84.6% |
| Maximum | 100.0% | 100.0% |
| Range | 94.3% | 15.4% |
| Mean | 69.4% | 96.1% |
| Median | 71.5% | 96.8% |
| Interquartile 25% (IQ1) | 57.2% | 94.4% |
| Interquartile 75% (IQ3) | 84.8% | 98.9% |
| Interquartile Range (IQR) | 27.6% | 4.5% |
| Standard Deviation (Sample) | 19.7% | 3.4% |
| Standard Deviation (Population) | 19.7% | 3.4% |
Similar Demographics by 10th Grade
Demographics Similar to Immigrants from Mexico by 10th Grade
In terms of 10th grade, the demographic groups most similar to Immigrants from Mexico are Spanish American Indian (86.2%, a difference of 0.010%), Immigrants from Central America (86.6%, a difference of 0.47%), Immigrants from El Salvador (86.8%, a difference of 0.65%), Yakama (86.9%, a difference of 0.78%), and Immigrants from Guatemala (87.4%, a difference of 1.4%).
| Demographics | Rating | Rank | 10th Grade |
| Hondurans | 0.0 /100 | #333 | Tragic 89.0% |
| Hispanics or Latinos | 0.0 /100 | #334 | Tragic 88.9% |
| Immigrants | Dominican Republic | 0.0 /100 | #335 | Tragic 88.7% |
| Immigrants | Honduras | 0.0 /100 | #336 | Tragic 88.5% |
| Central Americans | 0.0 /100 | #337 | Tragic 88.4% |
| Immigrants | Latin America | 0.0 /100 | #338 | Tragic 88.3% |
| Guatemalans | 0.0 /100 | #339 | Tragic 87.9% |
| Mexicans | 0.0 /100 | #340 | Tragic 87.8% |
| Salvadorans | 0.0 /100 | #341 | Tragic 87.5% |
| Immigrants | Guatemala | 0.0 /100 | #342 | Tragic 87.4% |
| Yakama | 0.0 /100 | #343 | Tragic 86.9% |
| Immigrants | El Salvador | 0.0 /100 | #344 | Tragic 86.8% |
| Immigrants | Central America | 0.0 /100 | #345 | Tragic 86.6% |
| Spanish American Indians | 0.0 /100 | #346 | Tragic 86.2% |
| Immigrants | Mexico | 0.0 /100 | #347 | Tragic 86.2% |
Demographics Similar to Celtics by 10th Grade
In terms of 10th grade, the demographic groups most similar to Celtics are Aleut (95.0%, a difference of 0.0%), Immigrants from Ireland (95.0%, a difference of 0.010%), New Zealander (95.0%, a difference of 0.010%), Ukrainian (95.0%, a difference of 0.010%), and Cypriot (95.0%, a difference of 0.010%).
| Demographics | Rating | Rank | 10th Grade |
| Ottawa | 99.8 /100 | #52 | Exceptional 95.1% |
| Immigrants | North America | 99.8 /100 | #53 | Exceptional 95.0% |
| Immigrants | Lithuania | 99.8 /100 | #54 | Exceptional 95.0% |
| Immigrants | Ireland | 99.8 /100 | #55 | Exceptional 95.0% |
| New Zealanders | 99.8 /100 | #56 | Exceptional 95.0% |
| Ukrainians | 99.8 /100 | #57 | Exceptional 95.0% |
| Aleuts | 99.8 /100 | #58 | Exceptional 95.0% |
| Celtics | 99.8 /100 | #59 | Exceptional 95.0% |
| Cypriots | 99.8 /100 | #60 | Exceptional 95.0% |
| Chippewa | 99.8 /100 | #61 | Exceptional 95.0% |
| Thais | 99.8 /100 | #62 | Exceptional 95.0% |
| Immigrants | Singapore | 99.8 /100 | #63 | Exceptional 95.0% |
| Native Hawaiians | 99.7 /100 | #64 | Exceptional 95.0% |
| Turks | 99.7 /100 | #65 | Exceptional 95.0% |
| Immigrants | Australia | 99.7 /100 | #66 | Exceptional 94.9% |