Immigrants from Mexico vs Immigrants from Dominican Republic Master's Degree
COMPARE
Immigrants from Mexico
Immigrants from Dominican Republic
Master's Degree
Master's Degree Comparison
Immigrants from Mexico
Immigrants from Dominican Republic
9.3%
MASTER'S DEGREE
0.0/ 100
METRIC RATING
342nd/ 347
METRIC RANK
12.1%
MASTER'S DEGREE
0.2/ 100
METRIC RATING
280th/ 347
METRIC RANK
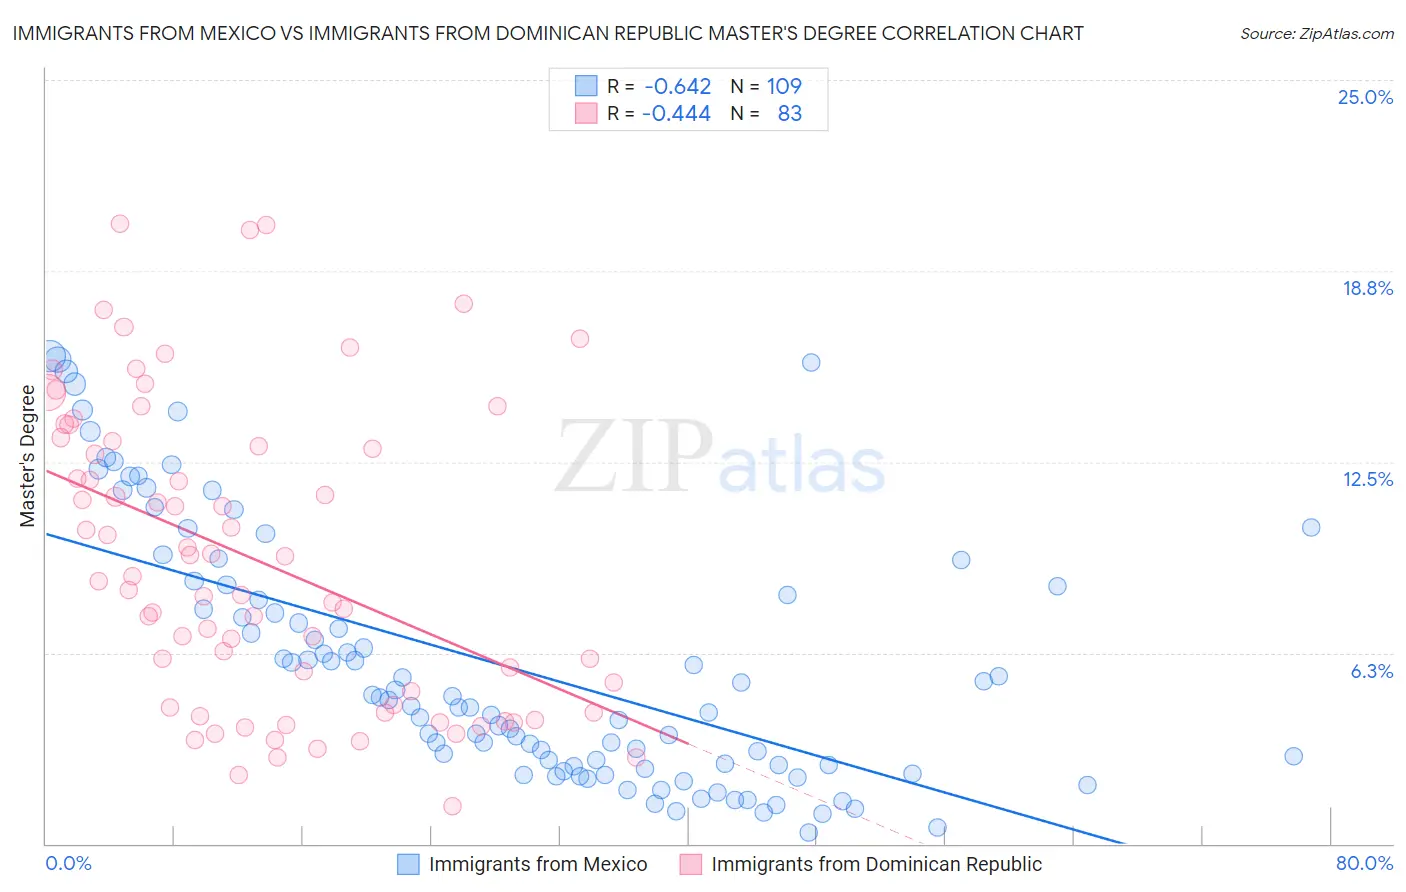
Immigrants from Mexico vs Immigrants from Dominican Republic Master's Degree Correlation Chart
The statistical analysis conducted on geographies consisting of 513,107,790 people shows a significant negative correlation between the proportion of Immigrants from Mexico and percentage of population with at least master's degree education in the United States with a correlation coefficient (R) of -0.642 and weighted average of 9.3%. Similarly, the statistical analysis conducted on geographies consisting of 275,069,954 people shows a moderate negative correlation between the proportion of Immigrants from Dominican Republic and percentage of population with at least master's degree education in the United States with a correlation coefficient (R) of -0.444 and weighted average of 12.1%, a difference of 29.4%.
Master's Degree Correlation Summary
| Measurement | Immigrants from Mexico | Immigrants from Dominican Republic |
| Minimum | 0.36% | 1.2% |
| Maximum | 16.0% | 20.3% |
| Range | 15.6% | 19.1% |
| Mean | 5.9% | 9.3% |
| Median | 4.7% | 8.6% |
| Interquartile 25% (IQ1) | 2.6% | 4.4% |
| Interquartile 75% (IQ3) | 8.5% | 13.2% |
| Interquartile Range (IQR) | 5.9% | 8.7% |
| Standard Deviation (Sample) | 4.2% | 4.9% |
| Standard Deviation (Population) | 4.1% | 4.9% |
Similar Demographics by Master's Degree
Demographics Similar to Immigrants from Mexico by Master's Degree
In terms of master's degree, the demographic groups most similar to Immigrants from Mexico are Lumbee (9.3%, a difference of 0.48%), Pima (9.2%, a difference of 0.65%), Yuman (9.2%, a difference of 0.81%), Navajo (9.4%, a difference of 1.3%), and Yakama (9.5%, a difference of 1.6%).
| Demographics | Rating | Rank | Master's Degree |
| Menominee | 0.0 /100 | #333 | Tragic 10.2% |
| Arapaho | 0.0 /100 | #334 | Tragic 10.0% |
| Immigrants | Central America | 0.0 /100 | #335 | Tragic 10.0% |
| Natives/Alaskans | 0.0 /100 | #336 | Tragic 9.9% |
| Mexicans | 0.0 /100 | #337 | Tragic 9.7% |
| Tohono O'odham | 0.0 /100 | #338 | Tragic 9.7% |
| Spanish American Indians | 0.0 /100 | #339 | Tragic 9.6% |
| Yakama | 0.0 /100 | #340 | Tragic 9.5% |
| Navajo | 0.0 /100 | #341 | Tragic 9.4% |
| Immigrants | Mexico | 0.0 /100 | #342 | Tragic 9.3% |
| Lumbee | 0.0 /100 | #343 | Tragic 9.3% |
| Pima | 0.0 /100 | #344 | Tragic 9.2% |
| Yuman | 0.0 /100 | #345 | Tragic 9.2% |
| Yup'ik | 0.0 /100 | #346 | Tragic 8.5% |
| Houma | 0.0 /100 | #347 | Tragic 7.9% |
Demographics Similar to Immigrants from Dominican Republic by Master's Degree
In terms of master's degree, the demographic groups most similar to Immigrants from Dominican Republic are Immigrants from Belize (12.1%, a difference of 0.060%), Malaysian (12.0%, a difference of 0.12%), Potawatomi (12.1%, a difference of 0.13%), Immigrants from Caribbean (12.1%, a difference of 0.14%), and Black/African American (12.1%, a difference of 0.15%).
| Demographics | Rating | Rank | Master's Degree |
| Blackfeet | 0.3 /100 | #273 | Tragic 12.1% |
| Cape Verdeans | 0.3 /100 | #274 | Tragic 12.1% |
| Cubans | 0.3 /100 | #275 | Tragic 12.1% |
| Blacks/African Americans | 0.3 /100 | #276 | Tragic 12.1% |
| Immigrants | Caribbean | 0.3 /100 | #277 | Tragic 12.1% |
| Potawatomi | 0.3 /100 | #278 | Tragic 12.1% |
| Immigrants | Belize | 0.2 /100 | #279 | Tragic 12.1% |
| Immigrants | Dominican Republic | 0.2 /100 | #280 | Tragic 12.1% |
| Malaysians | 0.2 /100 | #281 | Tragic 12.0% |
| Immigrants | El Salvador | 0.2 /100 | #282 | Tragic 12.0% |
| Hondurans | 0.2 /100 | #283 | Tragic 11.9% |
| Ottawa | 0.2 /100 | #284 | Tragic 11.9% |
| Immigrants | Nicaragua | 0.2 /100 | #285 | Tragic 11.8% |
| Aleuts | 0.1 /100 | #286 | Tragic 11.8% |
| Immigrants | Haiti | 0.1 /100 | #287 | Tragic 11.8% |