Immigrants from Lebanon vs Samoan College, 1 year or more
COMPARE
Immigrants from Lebanon
Samoan
College, 1 year or more
College, 1 year or more Comparison
Immigrants from Lebanon
Samoans
62.9%
COLLEGE, 1 YEAR OR MORE
98.8/ 100
METRIC RATING
78th/ 347
METRIC RANK
56.2%
COLLEGE, 1 YEAR OR MORE
1.6/ 100
METRIC RATING
237th/ 347
METRIC RANK
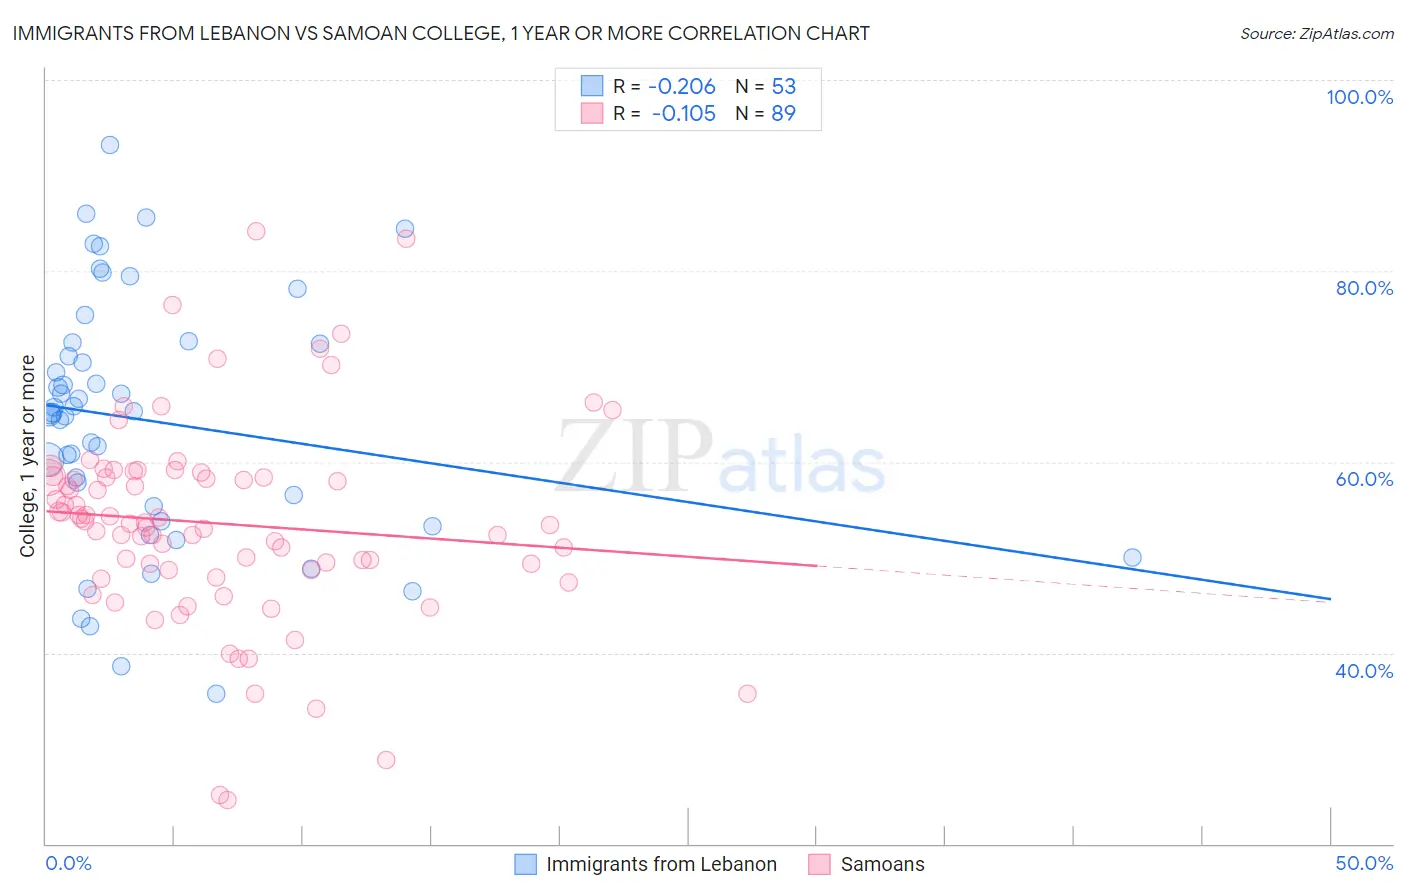
Immigrants from Lebanon vs Samoan College, 1 year or more Correlation Chart
The statistical analysis conducted on geographies consisting of 217,164,247 people shows a weak negative correlation between the proportion of Immigrants from Lebanon and percentage of population with at least college, 1 year or more education in the United States with a correlation coefficient (R) of -0.206 and weighted average of 62.9%. Similarly, the statistical analysis conducted on geographies consisting of 225,205,919 people shows a poor negative correlation between the proportion of Samoans and percentage of population with at least college, 1 year or more education in the United States with a correlation coefficient (R) of -0.105 and weighted average of 56.2%, a difference of 12.0%.
College, 1 year or more Correlation Summary
| Measurement | Immigrants from Lebanon | Samoan |
| Minimum | 35.7% | 24.6% |
| Maximum | 93.2% | 84.1% |
| Range | 57.5% | 59.5% |
| Mean | 64.3% | 53.6% |
| Median | 65.2% | 53.6% |
| Interquartile 25% (IQ1) | 54.6% | 48.7% |
| Interquartile 75% (IQ3) | 72.4% | 58.5% |
| Interquartile Range (IQR) | 17.8% | 9.8% |
| Standard Deviation (Sample) | 13.0% | 10.6% |
| Standard Deviation (Population) | 12.9% | 10.5% |
Similar Demographics by College, 1 year or more
Demographics Similar to Immigrants from Lebanon by College, 1 year or more
In terms of college, 1 year or more, the demographic groups most similar to Immigrants from Lebanon are Northern European (62.9%, a difference of 0.010%), Paraguayan (62.9%, a difference of 0.020%), Ethiopian (62.9%, a difference of 0.020%), Lithuanian (62.9%, a difference of 0.050%), and Laotian (62.8%, a difference of 0.11%).
| Demographics | Rating | Rank | College, 1 year or more |
| Immigrants | Canada | 99.1 /100 | #71 | Exceptional 63.1% |
| Egyptians | 99.0 /100 | #72 | Exceptional 63.1% |
| Immigrants | Moldova | 99.0 /100 | #73 | Exceptional 63.0% |
| Immigrants | North America | 99.0 /100 | #74 | Exceptional 63.0% |
| Armenians | 98.9 /100 | #75 | Exceptional 63.0% |
| Paraguayans | 98.8 /100 | #76 | Exceptional 62.9% |
| Ethiopians | 98.8 /100 | #77 | Exceptional 62.9% |
| Immigrants | Lebanon | 98.8 /100 | #78 | Exceptional 62.9% |
| Northern Europeans | 98.8 /100 | #79 | Exceptional 62.9% |
| Lithuanians | 98.8 /100 | #80 | Exceptional 62.9% |
| Laotians | 98.7 /100 | #81 | Exceptional 62.8% |
| Immigrants | Bolivia | 98.7 /100 | #82 | Exceptional 62.8% |
| Immigrants | Argentina | 98.6 /100 | #83 | Exceptional 62.8% |
| Immigrants | England | 98.6 /100 | #84 | Exceptional 62.8% |
| Immigrants | Pakistan | 98.6 /100 | #85 | Exceptional 62.8% |
Demographics Similar to Samoans by College, 1 year or more
In terms of college, 1 year or more, the demographic groups most similar to Samoans are Iroquois (56.2%, a difference of 0.11%), Spanish American (56.3%, a difference of 0.16%), West Indian (56.3%, a difference of 0.16%), Barbadian (56.0%, a difference of 0.27%), and Puget Sound Salish (55.9%, a difference of 0.47%).
| Demographics | Rating | Rank | College, 1 year or more |
| Liberians | 3.1 /100 | #230 | Tragic 56.7% |
| Immigrants | Burma/Myanmar | 2.7 /100 | #231 | Tragic 56.6% |
| Immigrants | Bangladesh | 2.6 /100 | #232 | Tragic 56.6% |
| Immigrants | Nonimmigrants | 2.5 /100 | #233 | Tragic 56.5% |
| Spanish Americans | 1.8 /100 | #234 | Tragic 56.3% |
| West Indians | 1.8 /100 | #235 | Tragic 56.3% |
| Iroquois | 1.7 /100 | #236 | Tragic 56.2% |
| Samoans | 1.6 /100 | #237 | Tragic 56.2% |
| Barbadians | 1.3 /100 | #238 | Tragic 56.0% |
| Puget Sound Salish | 1.1 /100 | #239 | Tragic 55.9% |
| Trinidadians and Tobagonians | 1.1 /100 | #240 | Tragic 55.8% |
| French American Indians | 1.0 /100 | #241 | Tragic 55.8% |
| Marshallese | 1.0 /100 | #242 | Tragic 55.8% |
| Osage | 1.0 /100 | #243 | Tragic 55.8% |
| Chippewa | 0.9 /100 | #244 | Tragic 55.7% |