Immigrants from Latvia vs Immigrants from Bangladesh No Schooling Completed
COMPARE
Immigrants from Latvia
Immigrants from Bangladesh
No Schooling Completed
No Schooling Completed Comparison
Immigrants from Latvia
Immigrants from Bangladesh
1.9%
NO SCHOOLING COMPLETED
96.7/ 100
METRIC RATING
110th/ 347
METRIC RANK
3.1%
NO SCHOOLING COMPLETED
0.0/ 100
METRIC RATING
320th/ 347
METRIC RANK
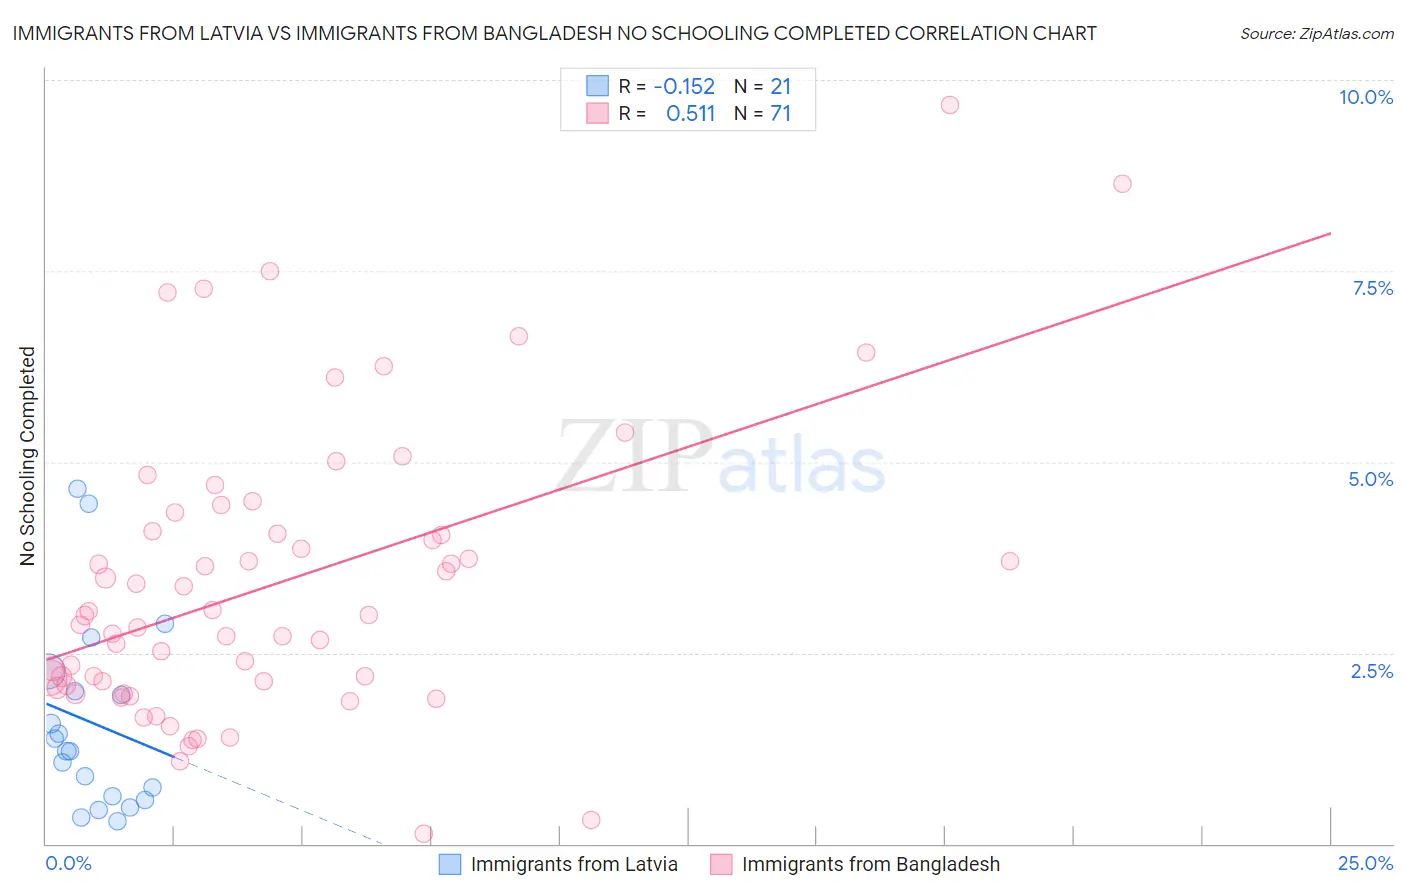
Immigrants from Latvia vs Immigrants from Bangladesh No Schooling Completed Correlation Chart
The statistical analysis conducted on geographies consisting of 113,303,053 people shows a poor negative correlation between the proportion of Immigrants from Latvia and percentage of population with no schooling in the United States with a correlation coefficient (R) of -0.152 and weighted average of 1.9%. Similarly, the statistical analysis conducted on geographies consisting of 203,165,011 people shows a substantial positive correlation between the proportion of Immigrants from Bangladesh and percentage of population with no schooling in the United States with a correlation coefficient (R) of 0.511 and weighted average of 3.1%, a difference of 69.6%.
No Schooling Completed Correlation Summary
| Measurement | Immigrants from Latvia | Immigrants from Bangladesh |
| Minimum | 0.30% | 0.13% |
| Maximum | 4.7% | 9.7% |
| Range | 4.4% | 9.6% |
| Mean | 1.6% | 3.4% |
| Median | 1.2% | 3.0% |
| Interquartile 25% (IQ1) | 0.59% | 2.1% |
| Interquartile 75% (IQ3) | 2.1% | 4.1% |
| Interquartile Range (IQR) | 1.5% | 2.0% |
| Standard Deviation (Sample) | 1.2% | 1.9% |
| Standard Deviation (Population) | 1.2% | 1.9% |
Similar Demographics by No Schooling Completed
Demographics Similar to Immigrants from Latvia by No Schooling Completed
In terms of no schooling completed, the demographic groups most similar to Immigrants from Latvia are Immigrants from Saudi Arabia (1.9%, a difference of 0.13%), Immigrants from Japan (1.9%, a difference of 0.15%), Pueblo (1.9%, a difference of 0.33%), Okinawan (1.8%, a difference of 0.48%), and Immigrants from Zimbabwe (1.9%, a difference of 0.58%).
| Demographics | Rating | Rank | No Schooling Completed |
| Basques | 97.9 /100 | #103 | Exceptional 1.8% |
| Thais | 97.5 /100 | #104 | Exceptional 1.8% |
| German Russians | 97.5 /100 | #105 | Exceptional 1.8% |
| Immigrants | France | 97.3 /100 | #106 | Exceptional 1.8% |
| Yugoslavians | 97.2 /100 | #107 | Exceptional 1.8% |
| Okinawans | 97.1 /100 | #108 | Exceptional 1.8% |
| Immigrants | Saudi Arabia | 96.8 /100 | #109 | Exceptional 1.9% |
| Immigrants | Latvia | 96.7 /100 | #110 | Exceptional 1.9% |
| Immigrants | Japan | 96.6 /100 | #111 | Exceptional 1.9% |
| Pueblo | 96.4 /100 | #112 | Exceptional 1.9% |
| Immigrants | Zimbabwe | 96.2 /100 | #113 | Exceptional 1.9% |
| Immigrants | Norway | 96.1 /100 | #114 | Exceptional 1.9% |
| Syrians | 96.0 /100 | #115 | Exceptional 1.9% |
| Lebanese | 96.0 /100 | #116 | Exceptional 1.9% |
| Immigrants | Serbia | 95.8 /100 | #117 | Exceptional 1.9% |
Demographics Similar to Immigrants from Bangladesh by No Schooling Completed
In terms of no schooling completed, the demographic groups most similar to Immigrants from Bangladesh are Immigrants from Burma/Myanmar (3.1%, a difference of 0.040%), Immigrants from Laos (3.1%, a difference of 0.11%), Immigrants from Guyana (3.1%, a difference of 0.78%), Immigrants from Honduras (3.2%, a difference of 0.79%), and Vietnamese (3.2%, a difference of 0.98%).
| Demographics | Rating | Rank | No Schooling Completed |
| Hondurans | 0.0 /100 | #313 | Tragic 3.1% |
| Immigrants | Belize | 0.0 /100 | #314 | Tragic 3.1% |
| Immigrants | Nicaragua | 0.0 /100 | #315 | Tragic 3.1% |
| Immigrants | Ecuador | 0.0 /100 | #316 | Tragic 3.1% |
| Cape Verdeans | 0.0 /100 | #317 | Tragic 3.1% |
| Immigrants | Guyana | 0.0 /100 | #318 | Tragic 3.1% |
| Immigrants | Burma/Myanmar | 0.0 /100 | #319 | Tragic 3.1% |
| Immigrants | Bangladesh | 0.0 /100 | #320 | Tragic 3.1% |
| Immigrants | Laos | 0.0 /100 | #321 | Tragic 3.1% |
| Immigrants | Honduras | 0.0 /100 | #322 | Tragic 3.2% |
| Vietnamese | 0.0 /100 | #323 | Tragic 3.2% |
| Mexican American Indians | 0.0 /100 | #324 | Tragic 3.2% |
| Dominicans | 0.0 /100 | #325 | Tragic 3.2% |
| Indonesians | 0.0 /100 | #326 | Tragic 3.2% |
| Immigrants | Latin America | 0.0 /100 | #327 | Tragic 3.3% |