Immigrants from Latvia vs Palestinian Nursery School
COMPARE
Immigrants from Latvia
Palestinian
Nursery School
Nursery School Comparison
Immigrants from Latvia
Palestinians
98.2%
NURSERY SCHOOL
96.4/ 100
METRIC RATING
113th/ 347
METRIC RANK
98.1%
NURSERY SCHOOL
83.7/ 100
METRIC RATING
140th/ 347
METRIC RANK
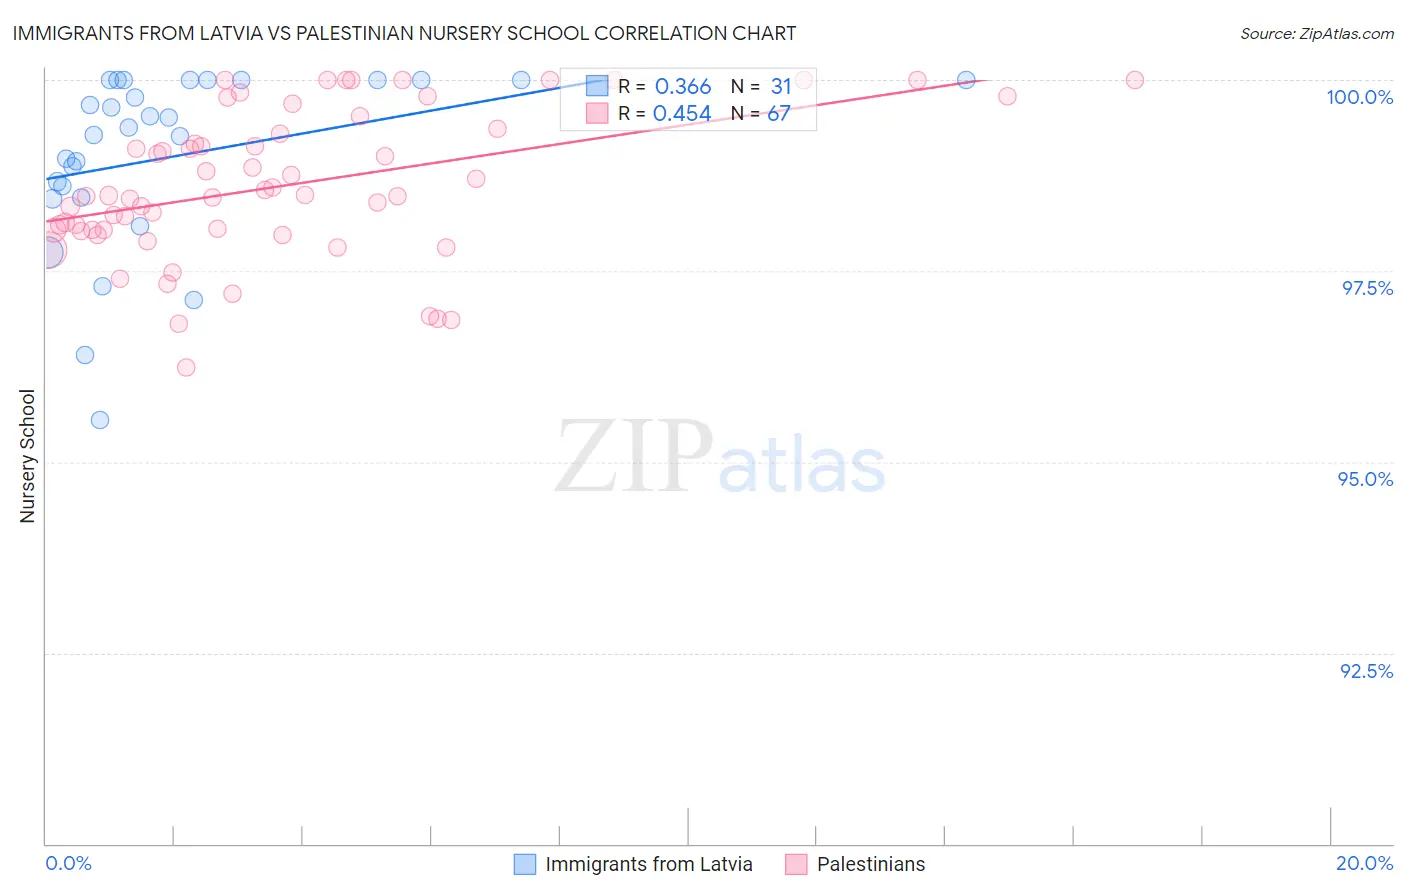
Immigrants from Latvia vs Palestinian Nursery School Correlation Chart
The statistical analysis conducted on geographies consisting of 113,735,345 people shows a mild positive correlation between the proportion of Immigrants from Latvia and percentage of population with at least nursery school education in the United States with a correlation coefficient (R) of 0.366 and weighted average of 98.2%. Similarly, the statistical analysis conducted on geographies consisting of 216,457,008 people shows a moderate positive correlation between the proportion of Palestinians and percentage of population with at least nursery school education in the United States with a correlation coefficient (R) of 0.454 and weighted average of 98.1%, a difference of 0.12%.
Nursery School Correlation Summary
| Measurement | Immigrants from Latvia | Palestinian |
| Minimum | 95.5% | 96.2% |
| Maximum | 100.0% | 100.0% |
| Range | 4.5% | 3.8% |
| Mean | 99.0% | 98.6% |
| Median | 99.4% | 98.5% |
| Interquartile 25% (IQ1) | 98.5% | 98.0% |
| Interquartile 75% (IQ3) | 100.0% | 99.4% |
| Interquartile Range (IQR) | 1.5% | 1.3% |
| Standard Deviation (Sample) | 1.2% | 0.96% |
| Standard Deviation (Population) | 1.1% | 0.95% |
Similar Demographics by Nursery School
Demographics Similar to Immigrants from Latvia by Nursery School
In terms of nursery school, the demographic groups most similar to Immigrants from Latvia are Immigrants from Norway (98.2%, a difference of 0.0%), Ute (98.2%, a difference of 0.0%), Iranian (98.2%, a difference of 0.0%), Immigrants from Singapore (98.2%, a difference of 0.010%), and Immigrants from Czechoslovakia (98.2%, a difference of 0.010%).
| Demographics | Rating | Rank | Nursery School |
| Immigrants | Switzerland | 97.3 /100 | #106 | Exceptional 98.2% |
| Basques | 97.3 /100 | #107 | Exceptional 98.2% |
| Pima | 97.1 /100 | #108 | Exceptional 98.2% |
| German Russians | 97.1 /100 | #109 | Exceptional 98.2% |
| Immigrants | Singapore | 96.9 /100 | #110 | Exceptional 98.2% |
| Immigrants | Czechoslovakia | 96.8 /100 | #111 | Exceptional 98.2% |
| Immigrants | Norway | 96.6 /100 | #112 | Exceptional 98.2% |
| Immigrants | Latvia | 96.4 /100 | #113 | Exceptional 98.2% |
| Ute | 96.4 /100 | #114 | Exceptional 98.2% |
| Iranians | 96.3 /100 | #115 | Exceptional 98.2% |
| Spanish | 95.8 /100 | #116 | Exceptional 98.2% |
| Immigrants | France | 95.6 /100 | #117 | Exceptional 98.2% |
| Yugoslavians | 95.4 /100 | #118 | Exceptional 98.2% |
| Thais | 95.0 /100 | #119 | Exceptional 98.2% |
| Okinawans | 94.5 /100 | #120 | Exceptional 98.2% |
Demographics Similar to Palestinians by Nursery School
In terms of nursery school, the demographic groups most similar to Palestinians are Immigrants from Turkey (98.1%, a difference of 0.0%), Burmese (98.1%, a difference of 0.010%), Marshallese (98.1%, a difference of 0.010%), Blackfeet (98.1%, a difference of 0.020%), and Alsatian (98.1%, a difference of 0.020%).
| Demographics | Rating | Rank | Nursery School |
| Immigrants | Europe | 90.7 /100 | #133 | Exceptional 98.1% |
| Immigrants | Bulgaria | 89.4 /100 | #134 | Excellent 98.1% |
| Immigrants | Hungary | 89.3 /100 | #135 | Excellent 98.1% |
| Immigrants | Kuwait | 88.9 /100 | #136 | Excellent 98.1% |
| Israelis | 88.2 /100 | #137 | Excellent 98.1% |
| Immigrants | Romania | 88.0 /100 | #138 | Excellent 98.1% |
| Blackfeet | 87.5 /100 | #139 | Excellent 98.1% |
| Palestinians | 83.7 /100 | #140 | Excellent 98.1% |
| Immigrants | Turkey | 83.0 /100 | #141 | Excellent 98.1% |
| Burmese | 81.7 /100 | #142 | Excellent 98.1% |
| Marshallese | 81.2 /100 | #143 | Excellent 98.1% |
| Alsatians | 80.3 /100 | #144 | Excellent 98.1% |
| Immigrants | Israel | 78.5 /100 | #145 | Good 98.1% |
| Filipinos | 78.5 /100 | #146 | Good 98.1% |
| Hmong | 75.7 /100 | #147 | Good 98.1% |