Immigrants from Laos vs Dominican No Schooling Completed
COMPARE
Immigrants from Laos
Dominican
No Schooling Completed
No Schooling Completed Comparison
Immigrants from Laos
Dominicans
3.1%
NO SCHOOLING COMPLETED
0.0/ 100
METRIC RATING
321st/ 347
METRIC RANK
3.2%
NO SCHOOLING COMPLETED
0.0/ 100
METRIC RATING
325th/ 347
METRIC RANK
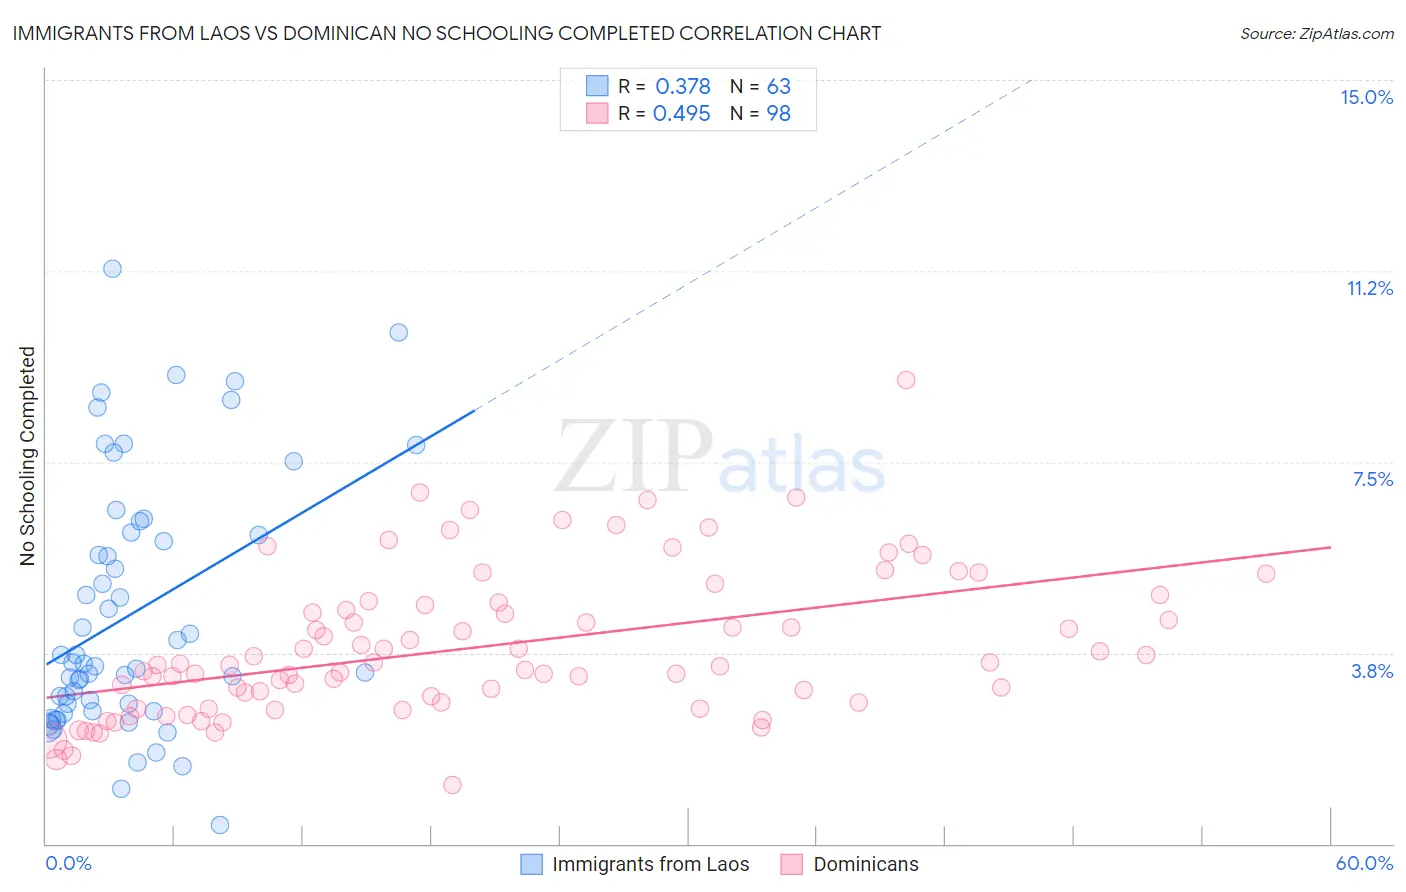
Immigrants from Laos vs Dominican No Schooling Completed Correlation Chart
The statistical analysis conducted on geographies consisting of 200,828,935 people shows a mild positive correlation between the proportion of Immigrants from Laos and percentage of population with no schooling in the United States with a correlation coefficient (R) of 0.378 and weighted average of 3.1%. Similarly, the statistical analysis conducted on geographies consisting of 352,198,650 people shows a moderate positive correlation between the proportion of Dominicans and percentage of population with no schooling in the United States with a correlation coefficient (R) of 0.495 and weighted average of 3.2%, a difference of 1.9%.
No Schooling Completed Correlation Summary
| Measurement | Immigrants from Laos | Dominican |
| Minimum | 0.36% | 1.2% |
| Maximum | 11.3% | 9.1% |
| Range | 10.9% | 8.0% |
| Mean | 4.5% | 3.9% |
| Median | 3.5% | 3.5% |
| Interquartile 25% (IQ1) | 2.6% | 2.8% |
| Interquartile 75% (IQ3) | 6.1% | 4.7% |
| Interquartile Range (IQR) | 3.5% | 1.9% |
| Standard Deviation (Sample) | 2.5% | 1.4% |
| Standard Deviation (Population) | 2.5% | 1.4% |
Demographics Similar to Immigrants from Laos and Dominicans by No Schooling Completed
In terms of no schooling completed, the demographic groups most similar to Immigrants from Laos are Immigrants from Bangladesh (3.1%, a difference of 0.11%), Immigrants from Burma/Myanmar (3.1%, a difference of 0.15%), Immigrants from Honduras (3.2%, a difference of 0.67%), Vietnamese (3.2%, a difference of 0.86%), and Immigrants from Guyana (3.1%, a difference of 0.89%). Similarly, the demographic groups most similar to Dominicans are Indonesian (3.2%, a difference of 0.030%), Mexican American Indian (3.2%, a difference of 0.67%), Vietnamese (3.2%, a difference of 1.0%), Immigrants from Honduras (3.2%, a difference of 1.2%), and Immigrants from Bangladesh (3.1%, a difference of 2.0%).
| Demographics | Rating | Rank | No Schooling Completed |
| Hondurans | 0.0 /100 | #313 | Tragic 3.1% |
| Immigrants | Belize | 0.0 /100 | #314 | Tragic 3.1% |
| Immigrants | Nicaragua | 0.0 /100 | #315 | Tragic 3.1% |
| Immigrants | Ecuador | 0.0 /100 | #316 | Tragic 3.1% |
| Cape Verdeans | 0.0 /100 | #317 | Tragic 3.1% |
| Immigrants | Guyana | 0.0 /100 | #318 | Tragic 3.1% |
| Immigrants | Burma/Myanmar | 0.0 /100 | #319 | Tragic 3.1% |
| Immigrants | Bangladesh | 0.0 /100 | #320 | Tragic 3.1% |
| Immigrants | Laos | 0.0 /100 | #321 | Tragic 3.1% |
| Immigrants | Honduras | 0.0 /100 | #322 | Tragic 3.2% |
| Vietnamese | 0.0 /100 | #323 | Tragic 3.2% |
| Mexican American Indians | 0.0 /100 | #324 | Tragic 3.2% |
| Dominicans | 0.0 /100 | #325 | Tragic 3.2% |
| Indonesians | 0.0 /100 | #326 | Tragic 3.2% |
| Immigrants | Latin America | 0.0 /100 | #327 | Tragic 3.3% |
| Mexicans | 0.0 /100 | #328 | Tragic 3.3% |
| Immigrants | Vietnam | 0.0 /100 | #329 | Tragic 3.3% |
| Immigrants | Armenia | 0.0 /100 | #330 | Tragic 3.3% |
| Japanese | 0.0 /100 | #331 | Tragic 3.3% |
| Central Americans | 0.0 /100 | #332 | Tragic 3.4% |
| Immigrants | Dominican Republic | 0.0 /100 | #333 | Tragic 3.4% |