Immigrants from Laos vs Nicaraguan No Schooling Completed
COMPARE
Immigrants from Laos
Nicaraguan
No Schooling Completed
No Schooling Completed Comparison
Immigrants from Laos
Nicaraguans
3.1%
NO SCHOOLING COMPLETED
0.0/ 100
METRIC RATING
321st/ 347
METRIC RANK
2.9%
NO SCHOOLING COMPLETED
0.0/ 100
METRIC RATING
304th/ 347
METRIC RANK
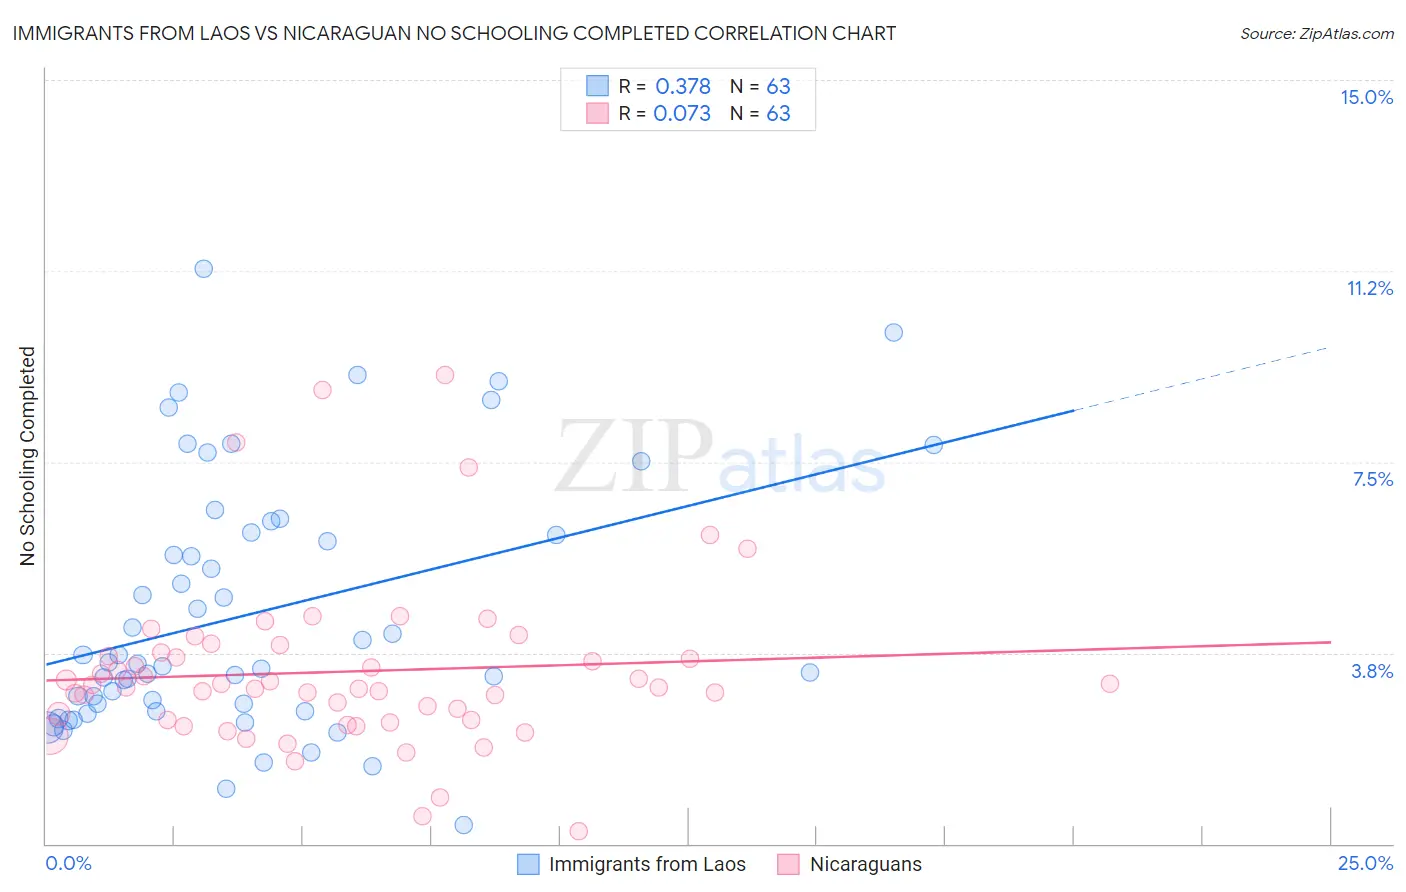
Immigrants from Laos vs Nicaraguan No Schooling Completed Correlation Chart
The statistical analysis conducted on geographies consisting of 200,828,935 people shows a mild positive correlation between the proportion of Immigrants from Laos and percentage of population with no schooling in the United States with a correlation coefficient (R) of 0.378 and weighted average of 3.1%. Similarly, the statistical analysis conducted on geographies consisting of 284,425,297 people shows a slight positive correlation between the proportion of Nicaraguans and percentage of population with no schooling in the United States with a correlation coefficient (R) of 0.073 and weighted average of 2.9%, a difference of 7.1%.
No Schooling Completed Correlation Summary
| Measurement | Immigrants from Laos | Nicaraguan |
| Minimum | 0.36% | 0.24% |
| Maximum | 11.3% | 9.2% |
| Range | 10.9% | 9.0% |
| Mean | 4.5% | 3.4% |
| Median | 3.5% | 3.1% |
| Interquartile 25% (IQ1) | 2.6% | 2.4% |
| Interquartile 75% (IQ3) | 6.1% | 3.8% |
| Interquartile Range (IQR) | 3.5% | 1.3% |
| Standard Deviation (Sample) | 2.5% | 1.7% |
| Standard Deviation (Population) | 2.5% | 1.6% |
Demographics Similar to Immigrants from Laos and Nicaraguans by No Schooling Completed
In terms of no schooling completed, the demographic groups most similar to Immigrants from Laos are Immigrants from Bangladesh (3.1%, a difference of 0.11%), Immigrants from Burma/Myanmar (3.1%, a difference of 0.15%), Immigrants from Honduras (3.2%, a difference of 0.67%), Immigrants from Guyana (3.1%, a difference of 0.89%), and Cape Verdean (3.1%, a difference of 1.6%). Similarly, the demographic groups most similar to Nicaraguans are Somali (2.9%, a difference of 0.19%), Ecuadorian (3.0%, a difference of 0.47%), Immigrants from Caribbean (2.9%, a difference of 1.2%), Belizean (3.0%, a difference of 2.1%), and Immigrants from Haiti (3.0%, a difference of 2.2%).
| Demographics | Rating | Rank | No Schooling Completed |
| Immigrants | Caribbean | 0.0 /100 | #302 | Tragic 2.9% |
| Somalis | 0.0 /100 | #303 | Tragic 2.9% |
| Nicaraguans | 0.0 /100 | #304 | Tragic 2.9% |
| Ecuadorians | 0.0 /100 | #305 | Tragic 3.0% |
| Belizeans | 0.0 /100 | #306 | Tragic 3.0% |
| Immigrants | Haiti | 0.0 /100 | #307 | Tragic 3.0% |
| Immigrants | Somalia | 0.0 /100 | #308 | Tragic 3.0% |
| Hispanics or Latinos | 0.0 /100 | #309 | Tragic 3.0% |
| Guyanese | 0.0 /100 | #310 | Tragic 3.0% |
| Immigrants | Azores | 0.0 /100 | #311 | Tragic 3.0% |
| Sri Lankans | 0.0 /100 | #312 | Tragic 3.0% |
| Hondurans | 0.0 /100 | #313 | Tragic 3.1% |
| Immigrants | Belize | 0.0 /100 | #314 | Tragic 3.1% |
| Immigrants | Nicaragua | 0.0 /100 | #315 | Tragic 3.1% |
| Immigrants | Ecuador | 0.0 /100 | #316 | Tragic 3.1% |
| Cape Verdeans | 0.0 /100 | #317 | Tragic 3.1% |
| Immigrants | Guyana | 0.0 /100 | #318 | Tragic 3.1% |
| Immigrants | Burma/Myanmar | 0.0 /100 | #319 | Tragic 3.1% |
| Immigrants | Bangladesh | 0.0 /100 | #320 | Tragic 3.1% |
| Immigrants | Laos | 0.0 /100 | #321 | Tragic 3.1% |
| Immigrants | Honduras | 0.0 /100 | #322 | Tragic 3.2% |