Immigrants from Laos vs Slovene 2nd Grade
COMPARE
Immigrants from Laos
Slovene
2nd Grade
2nd Grade Comparison
Immigrants from Laos
Slovenes
96.7%
2ND GRADE
0.0/ 100
METRIC RATING
317th/ 347
METRIC RANK
98.6%
2ND GRADE
100.0/ 100
METRIC RATING
10th/ 347
METRIC RANK
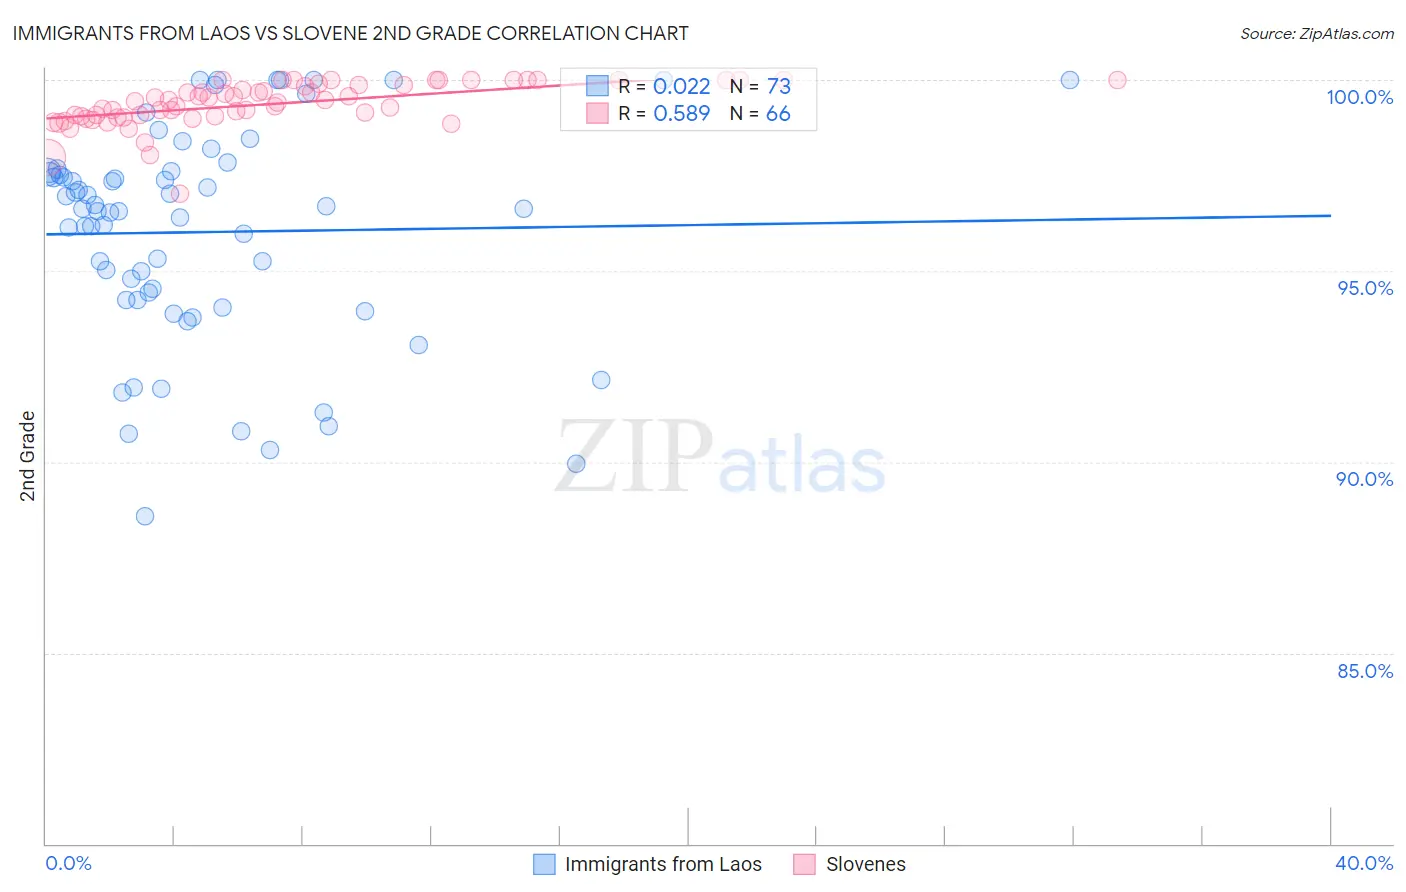
Immigrants from Laos vs Slovene 2nd Grade Correlation Chart
The statistical analysis conducted on geographies consisting of 201,453,273 people shows no correlation between the proportion of Immigrants from Laos and percentage of population with at least 2nd grade education in the United States with a correlation coefficient (R) of 0.022 and weighted average of 96.7%. Similarly, the statistical analysis conducted on geographies consisting of 261,353,374 people shows a substantial positive correlation between the proportion of Slovenes and percentage of population with at least 2nd grade education in the United States with a correlation coefficient (R) of 0.589 and weighted average of 98.6%, a difference of 1.9%.
2nd Grade Correlation Summary
| Measurement | Immigrants from Laos | Slovene |
| Minimum | 88.6% | 97.0% |
| Maximum | 100.0% | 100.0% |
| Range | 11.4% | 3.0% |
| Mean | 96.0% | 99.4% |
| Median | 96.6% | 99.5% |
| Interquartile 25% (IQ1) | 94.2% | 99.0% |
| Interquartile 75% (IQ3) | 97.6% | 99.9% |
| Interquartile Range (IQR) | 3.4% | 0.84% |
| Standard Deviation (Sample) | 2.8% | 0.57% |
| Standard Deviation (Population) | 2.8% | 0.57% |
Similar Demographics by 2nd Grade
Demographics Similar to Immigrants from Laos by 2nd Grade
In terms of 2nd grade, the demographic groups most similar to Immigrants from Laos are Honduran (96.7%, a difference of 0.0%), Indonesian (96.7%, a difference of 0.0%), Immigrants from Nicaragua (96.7%, a difference of 0.0%), Immigrants from Belize (96.8%, a difference of 0.010%), and Immigrants from Guyana (96.7%, a difference of 0.010%).
| Demographics | Rating | Rank | 2nd Grade |
| Sri Lankans | 0.0 /100 | #310 | Tragic 96.8% |
| Guyanese | 0.0 /100 | #311 | Tragic 96.8% |
| Cape Verdeans | 0.0 /100 | #312 | Tragic 96.8% |
| Hispanics or Latinos | 0.0 /100 | #313 | Tragic 96.8% |
| Immigrants | Ecuador | 0.0 /100 | #314 | Tragic 96.8% |
| Immigrants | Belize | 0.0 /100 | #315 | Tragic 96.8% |
| Hondurans | 0.0 /100 | #316 | Tragic 96.7% |
| Immigrants | Laos | 0.0 /100 | #317 | Tragic 96.7% |
| Indonesians | 0.0 /100 | #318 | Tragic 96.7% |
| Immigrants | Nicaragua | 0.0 /100 | #319 | Tragic 96.7% |
| Immigrants | Guyana | 0.0 /100 | #320 | Tragic 96.7% |
| Immigrants | Burma/Myanmar | 0.0 /100 | #321 | Tragic 96.7% |
| Immigrants | Bangladesh | 0.0 /100 | #322 | Tragic 96.7% |
| Vietnamese | 0.0 /100 | #323 | Tragic 96.7% |
| Mexican American Indians | 0.0 /100 | #324 | Tragic 96.7% |
Demographics Similar to Slovenes by 2nd Grade
In terms of 2nd grade, the demographic groups most similar to Slovenes are Tlingit-Haida (98.6%, a difference of 0.0%), Carpatho Rusyn (98.6%, a difference of 0.010%), English (98.6%, a difference of 0.010%), German (98.7%, a difference of 0.020%), and Slovak (98.7%, a difference of 0.020%).
| Demographics | Rating | Rank | 2nd Grade |
| Inupiat | 100.0 /100 | #3 | Exceptional 98.8% |
| Tsimshian | 100.0 /100 | #4 | Exceptional 98.8% |
| Alaskan Athabascans | 100.0 /100 | #5 | Exceptional 98.7% |
| Alaska Natives | 100.0 /100 | #6 | Exceptional 98.7% |
| Norwegians | 100.0 /100 | #7 | Exceptional 98.7% |
| Germans | 100.0 /100 | #8 | Exceptional 98.7% |
| Slovaks | 100.0 /100 | #9 | Exceptional 98.7% |
| Slovenes | 100.0 /100 | #10 | Exceptional 98.6% |
| Tlingit-Haida | 100.0 /100 | #11 | Exceptional 98.6% |
| Carpatho Rusyns | 100.0 /100 | #12 | Exceptional 98.6% |
| English | 100.0 /100 | #13 | Exceptional 98.6% |
| Swedes | 100.0 /100 | #14 | Exceptional 98.6% |
| Scottish | 100.0 /100 | #15 | Exceptional 98.6% |
| Dutch | 100.0 /100 | #16 | Exceptional 98.6% |
| Aleuts | 100.0 /100 | #17 | Exceptional 98.6% |