Immigrants from Laos vs Macedonian Divorced or Separated
COMPARE
Immigrants from Laos
Macedonian
Divorced or Separated
Divorced or Separated Comparison
Immigrants from Laos
Macedonians
12.4%
DIVORCED OR SEPARATED
4.2/ 100
METRIC RATING
237th/ 347
METRIC RANK
11.4%
DIVORCED OR SEPARATED
99.8/ 100
METRIC RATING
64th/ 347
METRIC RANK
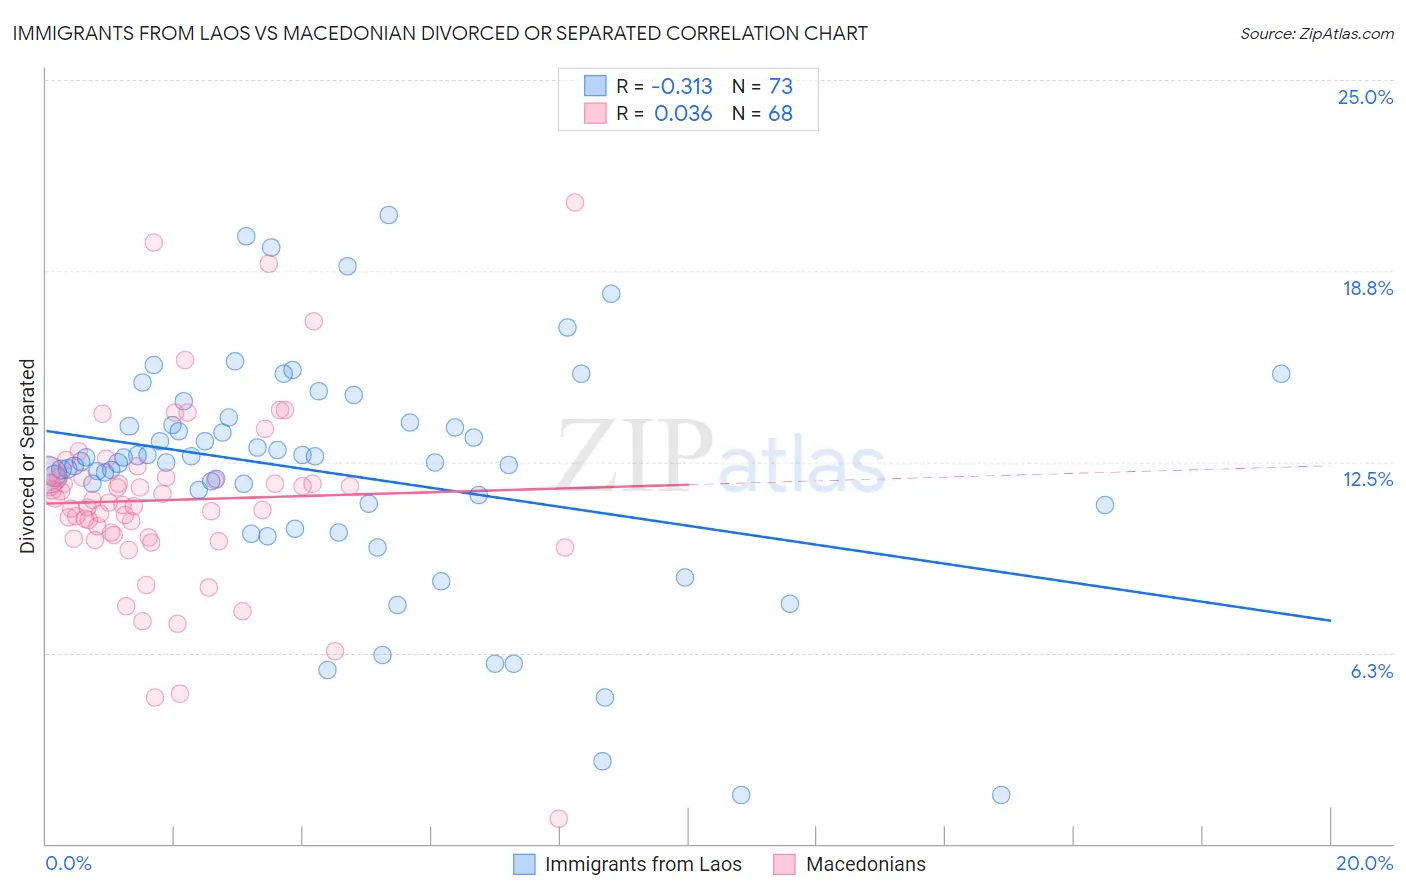
Immigrants from Laos vs Macedonian Divorced or Separated Correlation Chart
The statistical analysis conducted on geographies consisting of 201,474,624 people shows a mild negative correlation between the proportion of Immigrants from Laos and percentage of population currently divorced or separated in the United States with a correlation coefficient (R) of -0.313 and weighted average of 12.4%. Similarly, the statistical analysis conducted on geographies consisting of 132,616,839 people shows no correlation between the proportion of Macedonians and percentage of population currently divorced or separated in the United States with a correlation coefficient (R) of 0.036 and weighted average of 11.4%, a difference of 8.6%.
Divorced or Separated Correlation Summary
| Measurement | Immigrants from Laos | Macedonian |
| Minimum | 1.6% | 0.80% |
| Maximum | 20.6% | 21.0% |
| Range | 19.0% | 20.2% |
| Mean | 12.1% | 11.3% |
| Median | 12.5% | 11.2% |
| Interquartile 25% (IQ1) | 11.1% | 10.1% |
| Interquartile 75% (IQ3) | 13.7% | 12.0% |
| Interquartile Range (IQR) | 2.6% | 1.9% |
| Standard Deviation (Sample) | 3.8% | 3.1% |
| Standard Deviation (Population) | 3.7% | 3.1% |
Similar Demographics by Divorced or Separated
Demographics Similar to Immigrants from Laos by Divorced or Separated
In terms of divorced or separated, the demographic groups most similar to Immigrants from Laos are Colombian (12.4%, a difference of 0.0%), Immigrants from Bosnia and Herzegovina (12.4%, a difference of 0.030%), Sudanese (12.4%, a difference of 0.030%), Immigrants from Germany (12.4%, a difference of 0.040%), and West Indian (12.4%, a difference of 0.050%).
| Demographics | Rating | Rank | Divorced or Separated |
| Yakama | 7.8 /100 | #230 | Tragic 12.3% |
| Yugoslavians | 6.6 /100 | #231 | Tragic 12.3% |
| Canadians | 5.3 /100 | #232 | Tragic 12.4% |
| Malaysians | 4.8 /100 | #233 | Tragic 12.4% |
| West Indians | 4.4 /100 | #234 | Tragic 12.4% |
| Immigrants | Bosnia and Herzegovina | 4.3 /100 | #235 | Tragic 12.4% |
| Colombians | 4.2 /100 | #236 | Tragic 12.4% |
| Immigrants | Laos | 4.2 /100 | #237 | Tragic 12.4% |
| Sudanese | 4.0 /100 | #238 | Tragic 12.4% |
| Immigrants | Germany | 4.0 /100 | #239 | Tragic 12.4% |
| British West Indians | 3.7 /100 | #240 | Tragic 12.4% |
| Uruguayans | 3.4 /100 | #241 | Tragic 12.4% |
| Dutch | 3.1 /100 | #242 | Tragic 12.4% |
| Immigrants | Latin America | 2.8 /100 | #243 | Tragic 12.4% |
| Alaska Natives | 2.5 /100 | #244 | Tragic 12.4% |
Demographics Similar to Macedonians by Divorced or Separated
In terms of divorced or separated, the demographic groups most similar to Macedonians are Immigrants from South Eastern Asia (11.4%, a difference of 0.040%), Inupiat (11.4%, a difference of 0.18%), Immigrants from Syria (11.4%, a difference of 0.27%), Palestinian (11.5%, a difference of 0.38%), and Immigrants from Belgium (11.5%, a difference of 0.38%).
| Demographics | Rating | Rank | Divorced or Separated |
| Immigrants | Vietnam | 99.9 /100 | #57 | Exceptional 11.3% |
| Sri Lankans | 99.9 /100 | #58 | Exceptional 11.3% |
| Israelis | 99.9 /100 | #59 | Exceptional 11.3% |
| Immigrants | Russia | 99.9 /100 | #60 | Exceptional 11.3% |
| Koreans | 99.9 /100 | #61 | Exceptional 11.3% |
| Luxembourgers | 99.9 /100 | #62 | Exceptional 11.3% |
| Immigrants | Kuwait | 99.9 /100 | #63 | Exceptional 11.3% |
| Macedonians | 99.8 /100 | #64 | Exceptional 11.4% |
| Immigrants | South Eastern Asia | 99.8 /100 | #65 | Exceptional 11.4% |
| Inupiat | 99.8 /100 | #66 | Exceptional 11.4% |
| Immigrants | Syria | 99.7 /100 | #67 | Exceptional 11.4% |
| Palestinians | 99.7 /100 | #68 | Exceptional 11.5% |
| Immigrants | Belgium | 99.7 /100 | #69 | Exceptional 11.5% |
| Immigrants | Eastern Europe | 99.7 /100 | #70 | Exceptional 11.5% |
| Paraguayans | 99.7 /100 | #71 | Exceptional 11.5% |