Immigrants from Laos vs Macedonian 1st Grade
COMPARE
Immigrants from Laos
Macedonian
1st Grade
1st Grade Comparison
Immigrants from Laos
Macedonians
96.8%
1ST GRADE
0.0/ 100
METRIC RATING
318th/ 347
METRIC RANK
98.3%
1ST GRADE
98.7/ 100
METRIC RATING
92nd/ 347
METRIC RANK
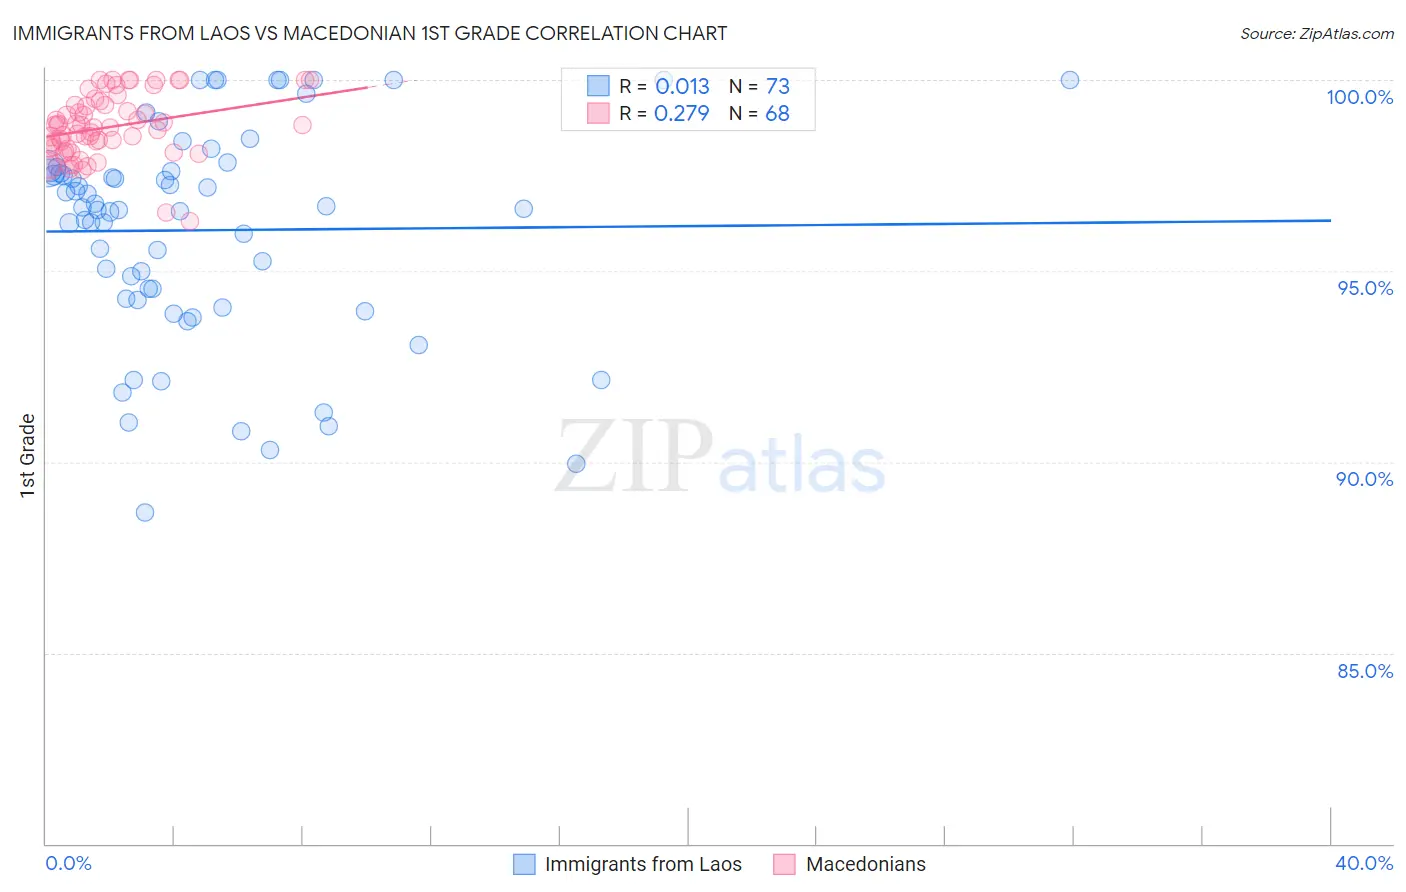
Immigrants from Laos vs Macedonian 1st Grade Correlation Chart
The statistical analysis conducted on geographies consisting of 201,453,273 people shows no correlation between the proportion of Immigrants from Laos and percentage of population with at least 1st grade education in the United States with a correlation coefficient (R) of 0.013 and weighted average of 96.8%. Similarly, the statistical analysis conducted on geographies consisting of 132,592,860 people shows a weak positive correlation between the proportion of Macedonians and percentage of population with at least 1st grade education in the United States with a correlation coefficient (R) of 0.279 and weighted average of 98.3%, a difference of 1.5%.
1st Grade Correlation Summary
| Measurement | Immigrants from Laos | Macedonian |
| Minimum | 88.7% | 96.3% |
| Maximum | 100.0% | 100.0% |
| Range | 11.3% | 3.7% |
| Mean | 96.1% | 98.8% |
| Median | 96.6% | 98.8% |
| Interquartile 25% (IQ1) | 94.3% | 98.2% |
| Interquartile 75% (IQ3) | 97.6% | 99.3% |
| Interquartile Range (IQR) | 3.4% | 1.1% |
| Standard Deviation (Sample) | 2.8% | 0.83% |
| Standard Deviation (Population) | 2.8% | 0.83% |
Similar Demographics by 1st Grade
Demographics Similar to Immigrants from Laos by 1st Grade
In terms of 1st grade, the demographic groups most similar to Immigrants from Laos are Immigrants from Guyana (96.8%, a difference of 0.010%), Immigrants from Burma/Myanmar (96.8%, a difference of 0.020%), Immigrants from Bangladesh (96.8%, a difference of 0.020%), Mexican American Indian (96.8%, a difference of 0.040%), and Immigrants from Ecuador (96.9%, a difference of 0.050%).
| Demographics | Rating | Rank | 1st Grade |
| Sri Lankans | 0.0 /100 | #311 | Tragic 96.9% |
| Cape Verdeans | 0.0 /100 | #312 | Tragic 96.9% |
| Guyanese | 0.0 /100 | #313 | Tragic 96.9% |
| Hondurans | 0.0 /100 | #314 | Tragic 96.9% |
| Immigrants | Belize | 0.0 /100 | #315 | Tragic 96.9% |
| Immigrants | Ecuador | 0.0 /100 | #316 | Tragic 96.9% |
| Immigrants | Nicaragua | 0.0 /100 | #317 | Tragic 96.9% |
| Immigrants | Laos | 0.0 /100 | #318 | Tragic 96.8% |
| Immigrants | Guyana | 0.0 /100 | #319 | Tragic 96.8% |
| Immigrants | Burma/Myanmar | 0.0 /100 | #320 | Tragic 96.8% |
| Immigrants | Bangladesh | 0.0 /100 | #321 | Tragic 96.8% |
| Mexican American Indians | 0.0 /100 | #322 | Tragic 96.8% |
| Immigrants | Honduras | 0.0 /100 | #323 | Tragic 96.8% |
| Vietnamese | 0.0 /100 | #324 | Tragic 96.8% |
| Dominicans | 0.0 /100 | #325 | Tragic 96.7% |
Demographics Similar to Macedonians by 1st Grade
In terms of 1st grade, the demographic groups most similar to Macedonians are Immigrants from Western Europe (98.3%, a difference of 0.0%), Zimbabwean (98.3%, a difference of 0.010%), Immigrants from South Africa (98.3%, a difference of 0.010%), Ukrainian (98.3%, a difference of 0.010%), and Immigrants from India (98.2%, a difference of 0.010%).
| Demographics | Rating | Rank | 1st Grade |
| Hopi | 99.0 /100 | #85 | Exceptional 98.3% |
| Immigrants | Denmark | 99.0 /100 | #86 | Exceptional 98.3% |
| Immigrants | Australia | 99.0 /100 | #87 | Exceptional 98.3% |
| Zimbabweans | 98.9 /100 | #88 | Exceptional 98.3% |
| Immigrants | South Africa | 98.8 /100 | #89 | Exceptional 98.3% |
| Ukrainians | 98.8 /100 | #90 | Exceptional 98.3% |
| Immigrants | Western Europe | 98.8 /100 | #91 | Exceptional 98.3% |
| Macedonians | 98.7 /100 | #92 | Exceptional 98.3% |
| Immigrants | India | 98.6 /100 | #93 | Exceptional 98.2% |
| South Africans | 98.6 /100 | #94 | Exceptional 98.2% |
| Immigrants | Germany | 98.5 /100 | #95 | Exceptional 98.2% |
| Cypriots | 98.3 /100 | #96 | Exceptional 98.2% |
| Immigrants | Nonimmigrants | 98.3 /100 | #97 | Exceptional 98.2% |
| Choctaw | 98.3 /100 | #98 | Exceptional 98.2% |
| Puget Sound Salish | 98.2 /100 | #99 | Exceptional 98.2% |