Ukrainian vs Immigrants from Costa Rica College, 1 year or more
COMPARE
Ukrainian
Immigrants from Costa Rica
College, 1 year or more
College, 1 year or more Comparison
Ukrainians
Immigrants from Costa Rica
61.8%
COLLEGE, 1 YEAR OR MORE
95.2/ 100
METRIC RATING
113th/ 347
METRIC RANK
57.5%
COLLEGE, 1 YEAR OR MORE
8.0/ 100
METRIC RATING
220th/ 347
METRIC RANK
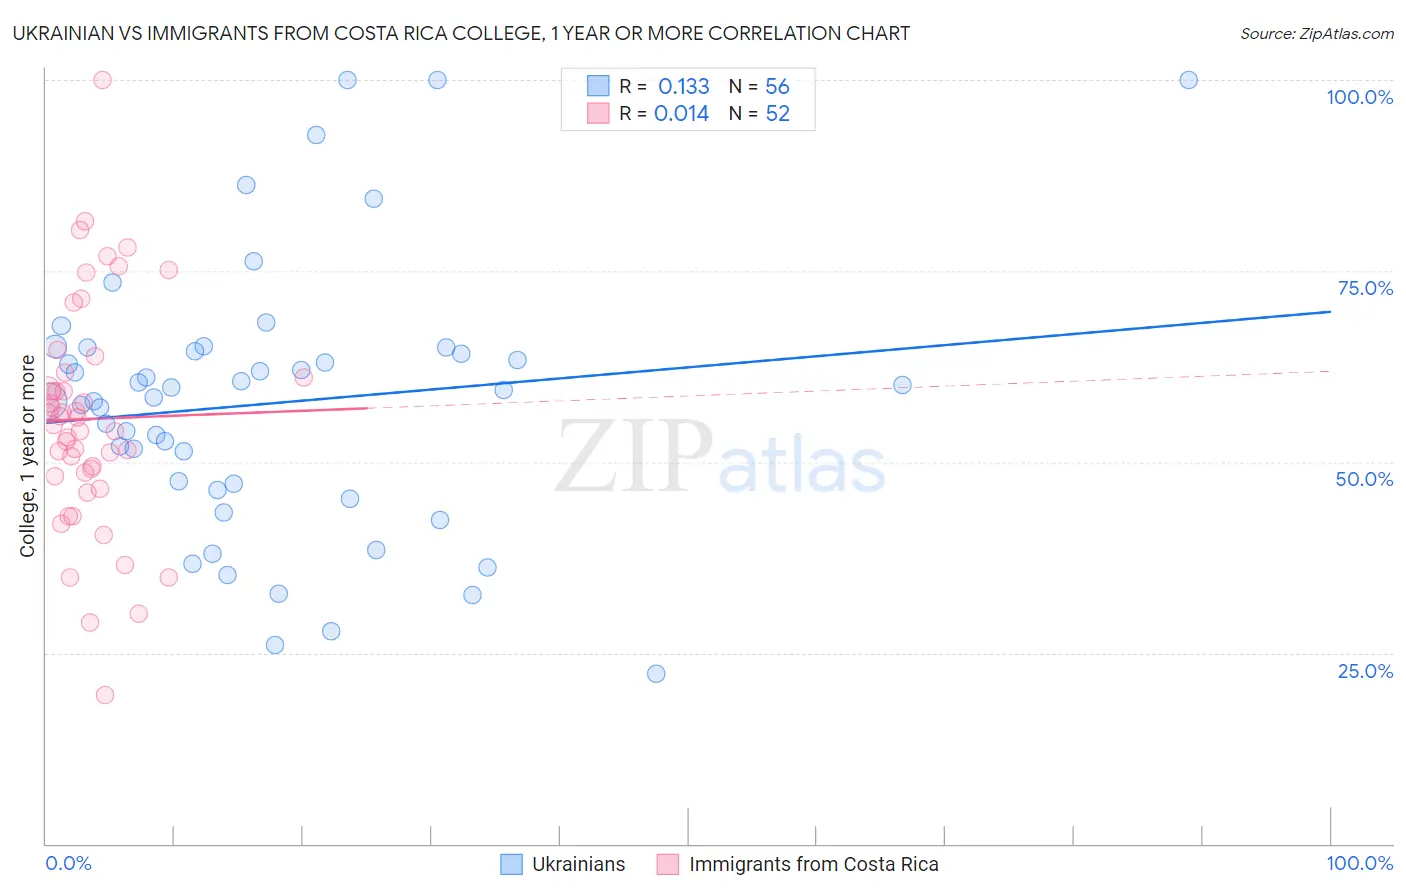
Ukrainian vs Immigrants from Costa Rica College, 1 year or more Correlation Chart
The statistical analysis conducted on geographies consisting of 448,693,874 people shows a poor positive correlation between the proportion of Ukrainians and percentage of population with at least college, 1 year or more education in the United States with a correlation coefficient (R) of 0.133 and weighted average of 61.8%. Similarly, the statistical analysis conducted on geographies consisting of 204,277,408 people shows no correlation between the proportion of Immigrants from Costa Rica and percentage of population with at least college, 1 year or more education in the United States with a correlation coefficient (R) of 0.014 and weighted average of 57.5%, a difference of 7.4%.
College, 1 year or more Correlation Summary
| Measurement | Ukrainian | Immigrants from Costa Rica |
| Minimum | 22.2% | 19.5% |
| Maximum | 100.0% | 100.0% |
| Range | 77.8% | 80.5% |
| Mean | 57.7% | 55.6% |
| Median | 58.9% | 55.4% |
| Interquartile 25% (IQ1) | 46.7% | 48.3% |
| Interquartile 75% (IQ3) | 64.7% | 61.4% |
| Interquartile Range (IQR) | 17.9% | 13.0% |
| Standard Deviation (Sample) | 17.6% | 14.8% |
| Standard Deviation (Population) | 17.5% | 14.7% |
Similar Demographics by College, 1 year or more
Demographics Similar to Ukrainians by College, 1 year or more
In terms of college, 1 year or more, the demographic groups most similar to Ukrainians are Austrian (61.8%, a difference of 0.070%), Danish (61.7%, a difference of 0.11%), European (61.8%, a difference of 0.13%), Macedonian (61.8%, a difference of 0.13%), and Immigrants from Northern Africa (61.9%, a difference of 0.14%).
| Demographics | Rating | Rank | College, 1 year or more |
| Palestinians | 96.3 /100 | #106 | Exceptional 62.0% |
| Immigrants | Ukraine | 95.8 /100 | #107 | Exceptional 61.9% |
| Syrians | 95.7 /100 | #108 | Exceptional 61.9% |
| Immigrants | Northern Africa | 95.7 /100 | #109 | Exceptional 61.9% |
| Europeans | 95.6 /100 | #110 | Exceptional 61.8% |
| Macedonians | 95.6 /100 | #111 | Exceptional 61.8% |
| Austrians | 95.4 /100 | #112 | Exceptional 61.8% |
| Ukrainians | 95.2 /100 | #113 | Exceptional 61.8% |
| Danes | 94.8 /100 | #114 | Exceptional 61.7% |
| Norwegians | 94.5 /100 | #115 | Exceptional 61.7% |
| Lebanese | 94.1 /100 | #116 | Exceptional 61.6% |
| Arabs | 93.9 /100 | #117 | Exceptional 61.6% |
| Immigrants | Brazil | 93.9 /100 | #118 | Exceptional 61.6% |
| Assyrians/Chaldeans/Syriacs | 93.3 /100 | #119 | Exceptional 61.5% |
| Pakistanis | 93.2 /100 | #120 | Exceptional 61.5% |
Demographics Similar to Immigrants from Costa Rica by College, 1 year or more
In terms of college, 1 year or more, the demographic groups most similar to Immigrants from Costa Rica are Immigrants from Ghana (57.4%, a difference of 0.070%), White/Caucasian (57.6%, a difference of 0.12%), Native Hawaiian (57.6%, a difference of 0.18%), Immigrants from Panama (57.6%, a difference of 0.19%), and Subsaharan African (57.3%, a difference of 0.41%).
| Demographics | Rating | Rank | College, 1 year or more |
| French Canadians | 11.8 /100 | #213 | Poor 57.8% |
| Immigrants | Colombia | 11.6 /100 | #214 | Poor 57.8% |
| Tongans | 11.6 /100 | #215 | Poor 57.8% |
| Immigrants | Peru | 10.6 /100 | #216 | Poor 57.7% |
| Immigrants | Panama | 9.1 /100 | #217 | Tragic 57.6% |
| Native Hawaiians | 9.0 /100 | #218 | Tragic 57.6% |
| Whites/Caucasians | 8.7 /100 | #219 | Tragic 57.6% |
| Immigrants | Costa Rica | 8.0 /100 | #220 | Tragic 57.5% |
| Immigrants | Ghana | 7.7 /100 | #221 | Tragic 57.4% |
| Sub-Saharan Africans | 6.1 /100 | #222 | Tragic 57.3% |
| Portuguese | 5.4 /100 | #223 | Tragic 57.2% |
| Hmong | 5.4 /100 | #224 | Tragic 57.2% |
| Vietnamese | 4.7 /100 | #225 | Tragic 57.0% |
| Immigrants | Western Africa | 4.6 /100 | #226 | Tragic 57.0% |
| Immigrants | Immigrants | 4.4 /100 | #227 | Tragic 57.0% |