Turkish vs Immigrants from Costa Rica College, 1 year or more
COMPARE
Turkish
Immigrants from Costa Rica
College, 1 year or more
College, 1 year or more Comparison
Turks
Immigrants from Costa Rica
65.5%
COLLEGE, 1 YEAR OR MORE
100.0/ 100
METRIC RATING
31st/ 347
METRIC RANK
57.5%
COLLEGE, 1 YEAR OR MORE
8.0/ 100
METRIC RATING
220th/ 347
METRIC RANK
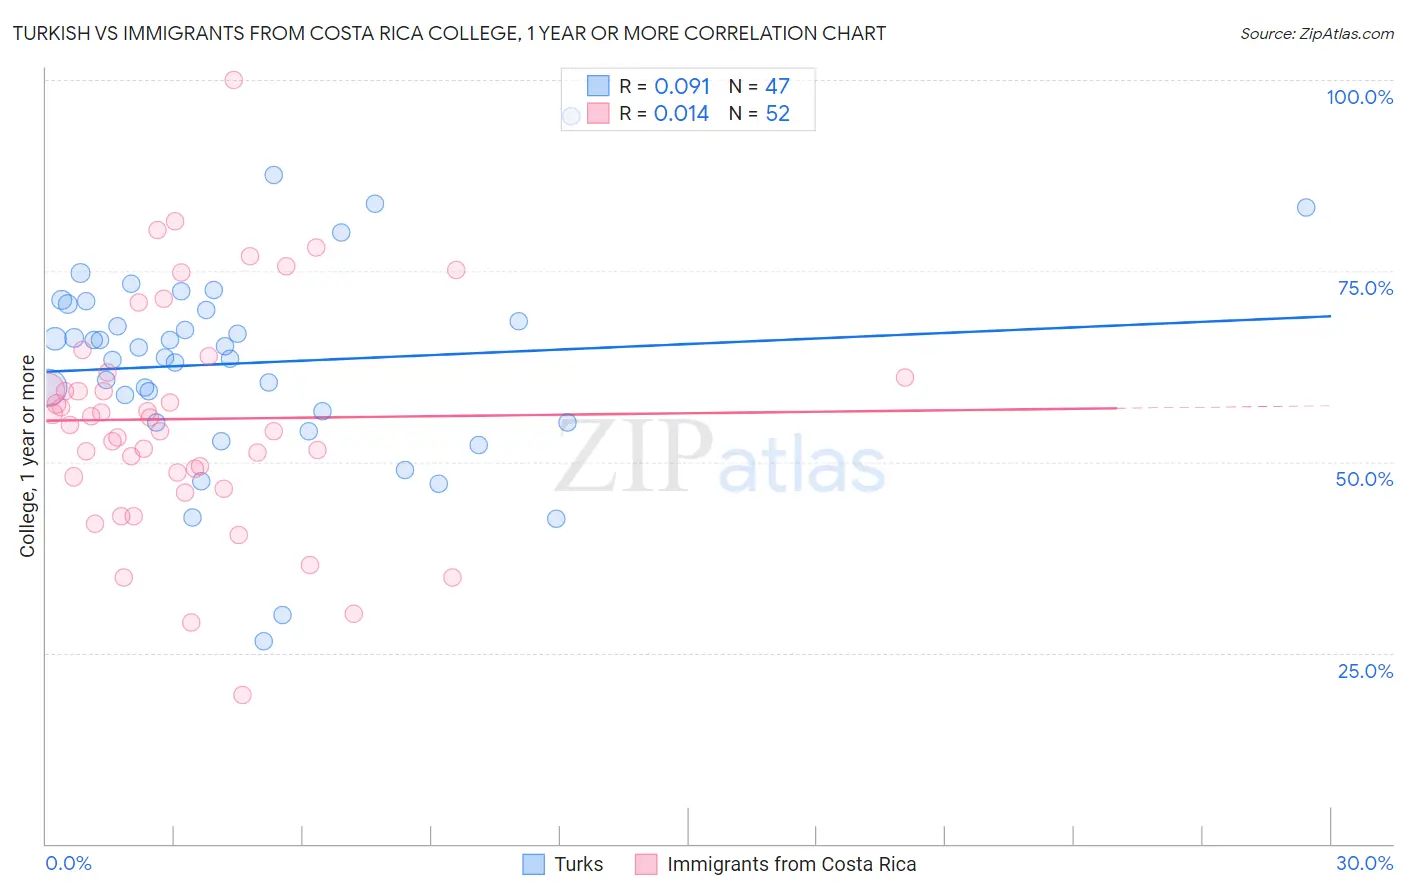
Turkish vs Immigrants from Costa Rica College, 1 year or more Correlation Chart
The statistical analysis conducted on geographies consisting of 271,864,133 people shows a slight positive correlation between the proportion of Turks and percentage of population with at least college, 1 year or more education in the United States with a correlation coefficient (R) of 0.091 and weighted average of 65.5%. Similarly, the statistical analysis conducted on geographies consisting of 204,277,408 people shows no correlation between the proportion of Immigrants from Costa Rica and percentage of population with at least college, 1 year or more education in the United States with a correlation coefficient (R) of 0.014 and weighted average of 57.5%, a difference of 14.0%.
College, 1 year or more Correlation Summary
| Measurement | Turkish | Immigrants from Costa Rica |
| Minimum | 26.5% | 19.5% |
| Maximum | 95.2% | 100.0% |
| Range | 68.7% | 80.5% |
| Mean | 63.0% | 55.6% |
| Median | 64.9% | 55.4% |
| Interquartile 25% (IQ1) | 55.1% | 48.3% |
| Interquartile 75% (IQ3) | 70.6% | 61.4% |
| Interquartile Range (IQR) | 15.5% | 13.0% |
| Standard Deviation (Sample) | 13.2% | 14.8% |
| Standard Deviation (Population) | 13.1% | 14.7% |
Similar Demographics by College, 1 year or more
Demographics Similar to Turks by College, 1 year or more
In terms of college, 1 year or more, the demographic groups most similar to Turks are Bulgarian (65.5%, a difference of 0.050%), Immigrants from Denmark (65.6%, a difference of 0.080%), Immigrants from Northern Europe (65.6%, a difference of 0.19%), Immigrants from Sri Lanka (65.4%, a difference of 0.20%), and Israeli (65.3%, a difference of 0.32%).
| Demographics | Rating | Rank | College, 1 year or more |
| Immigrants | Belgium | 100.0 /100 | #24 | Exceptional 66.3% |
| Indians (Asian) | 100.0 /100 | #25 | Exceptional 66.1% |
| Latvians | 100.0 /100 | #26 | Exceptional 66.1% |
| Immigrants | Ireland | 100.0 /100 | #27 | Exceptional 65.9% |
| Immigrants | France | 100.0 /100 | #28 | Exceptional 65.8% |
| Immigrants | Northern Europe | 100.0 /100 | #29 | Exceptional 65.6% |
| Immigrants | Denmark | 100.0 /100 | #30 | Exceptional 65.6% |
| Turks | 100.0 /100 | #31 | Exceptional 65.5% |
| Bulgarians | 100.0 /100 | #32 | Exceptional 65.5% |
| Immigrants | Sri Lanka | 99.9 /100 | #33 | Exceptional 65.4% |
| Israelis | 99.9 /100 | #34 | Exceptional 65.3% |
| Immigrants | Turkey | 99.9 /100 | #35 | Exceptional 65.2% |
| Immigrants | South Africa | 99.9 /100 | #36 | Exceptional 65.1% |
| Russians | 99.9 /100 | #37 | Exceptional 65.1% |
| Immigrants | Saudi Arabia | 99.9 /100 | #38 | Exceptional 65.0% |
Demographics Similar to Immigrants from Costa Rica by College, 1 year or more
In terms of college, 1 year or more, the demographic groups most similar to Immigrants from Costa Rica are Immigrants from Ghana (57.4%, a difference of 0.070%), White/Caucasian (57.6%, a difference of 0.12%), Native Hawaiian (57.6%, a difference of 0.18%), Immigrants from Panama (57.6%, a difference of 0.19%), and Subsaharan African (57.3%, a difference of 0.41%).
| Demographics | Rating | Rank | College, 1 year or more |
| French Canadians | 11.8 /100 | #213 | Poor 57.8% |
| Immigrants | Colombia | 11.6 /100 | #214 | Poor 57.8% |
| Tongans | 11.6 /100 | #215 | Poor 57.8% |
| Immigrants | Peru | 10.6 /100 | #216 | Poor 57.7% |
| Immigrants | Panama | 9.1 /100 | #217 | Tragic 57.6% |
| Native Hawaiians | 9.0 /100 | #218 | Tragic 57.6% |
| Whites/Caucasians | 8.7 /100 | #219 | Tragic 57.6% |
| Immigrants | Costa Rica | 8.0 /100 | #220 | Tragic 57.5% |
| Immigrants | Ghana | 7.7 /100 | #221 | Tragic 57.4% |
| Sub-Saharan Africans | 6.1 /100 | #222 | Tragic 57.3% |
| Portuguese | 5.4 /100 | #223 | Tragic 57.2% |
| Hmong | 5.4 /100 | #224 | Tragic 57.2% |
| Vietnamese | 4.7 /100 | #225 | Tragic 57.0% |
| Immigrants | Western Africa | 4.6 /100 | #226 | Tragic 57.0% |
| Immigrants | Immigrants | 4.4 /100 | #227 | Tragic 57.0% |