Immigrants from Kuwait vs Nonimmigrants Master's Degree
COMPARE
Immigrants from Kuwait
Nonimmigrants
Master's Degree
Master's Degree Comparison
Immigrants from Kuwait
Nonimmigrants
18.6%
MASTER'S DEGREE
100.0/ 100
METRIC RATING
52nd/ 347
METRIC RANK
13.3%
MASTER'S DEGREE
3.4/ 100
METRIC RATING
239th/ 347
METRIC RANK
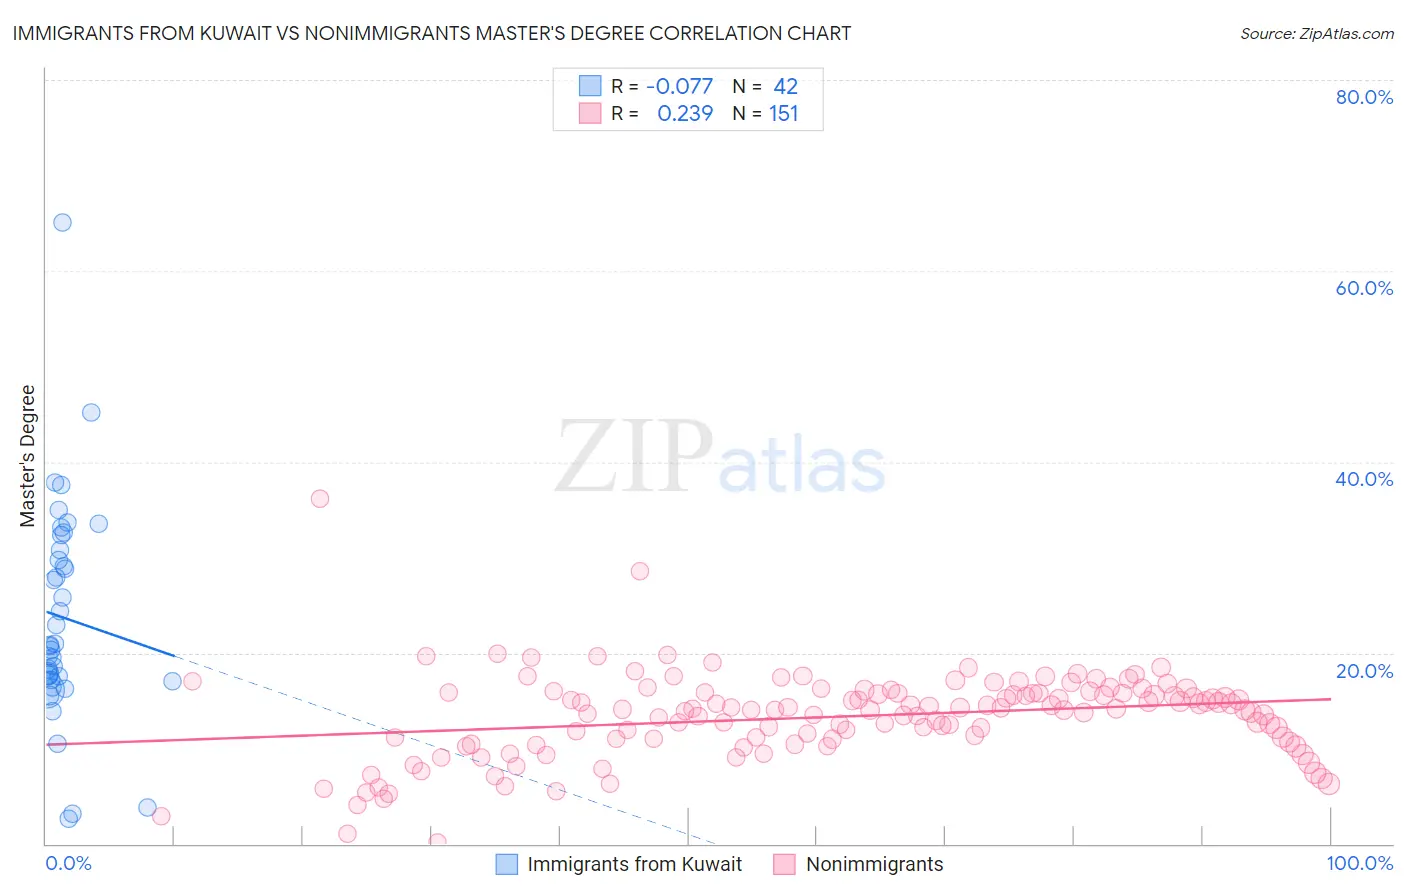
Immigrants from Kuwait vs Nonimmigrants Master's Degree Correlation Chart
The statistical analysis conducted on geographies consisting of 136,916,630 people shows a slight negative correlation between the proportion of Immigrants from Kuwait and percentage of population with at least master's degree education in the United States with a correlation coefficient (R) of -0.077 and weighted average of 18.6%. Similarly, the statistical analysis conducted on geographies consisting of 583,073,309 people shows a weak positive correlation between the proportion of Nonimmigrants and percentage of population with at least master's degree education in the United States with a correlation coefficient (R) of 0.239 and weighted average of 13.3%, a difference of 39.3%.
Master's Degree Correlation Summary
| Measurement | Immigrants from Kuwait | Nonimmigrants |
| Minimum | 2.6% | 0.15% |
| Maximum | 65.1% | 36.1% |
| Range | 62.5% | 36.0% |
| Mean | 23.7% | 13.3% |
| Median | 20.7% | 14.1% |
| Interquartile 25% (IQ1) | 17.1% | 11.0% |
| Interquartile 75% (IQ3) | 30.8% | 15.8% |
| Interquartile Range (IQR) | 13.7% | 4.8% |
| Standard Deviation (Sample) | 11.5% | 4.5% |
| Standard Deviation (Population) | 11.4% | 4.5% |
Similar Demographics by Master's Degree
Demographics Similar to Immigrants from Kuwait by Master's Degree
In terms of master's degree, the demographic groups most similar to Immigrants from Kuwait are Immigrants from Czechoslovakia (18.5%, a difference of 0.080%), Immigrants from Lithuania (18.5%, a difference of 0.39%), Immigrants from Serbia (18.5%, a difference of 0.42%), Asian (18.4%, a difference of 0.65%), and Immigrants from Asia (18.4%, a difference of 0.79%).
| Demographics | Rating | Rank | Master's Degree |
| Immigrants | Belarus | 100.0 /100 | #45 | Exceptional 18.9% |
| Immigrants | Norway | 100.0 /100 | #46 | Exceptional 18.8% |
| Immigrants | Austria | 100.0 /100 | #47 | Exceptional 18.8% |
| Paraguayans | 100.0 /100 | #48 | Exceptional 18.8% |
| Estonians | 100.0 /100 | #49 | Exceptional 18.8% |
| Bulgarians | 100.0 /100 | #50 | Exceptional 18.8% |
| Immigrants | South Africa | 100.0 /100 | #51 | Exceptional 18.8% |
| Immigrants | Kuwait | 100.0 /100 | #52 | Exceptional 18.6% |
| Immigrants | Czechoslovakia | 99.9 /100 | #53 | Exceptional 18.5% |
| Immigrants | Lithuania | 99.9 /100 | #54 | Exceptional 18.5% |
| Immigrants | Serbia | 99.9 /100 | #55 | Exceptional 18.5% |
| Asians | 99.9 /100 | #56 | Exceptional 18.4% |
| Immigrants | Asia | 99.9 /100 | #57 | Exceptional 18.4% |
| Australians | 99.9 /100 | #58 | Exceptional 18.4% |
| Immigrants | Bulgaria | 99.9 /100 | #59 | Exceptional 18.3% |
Demographics Similar to Nonimmigrants by Master's Degree
In terms of master's degree, the demographic groups most similar to Nonimmigrants are Hmong (13.4%, a difference of 0.53%), Jamaican (13.4%, a difference of 0.67%), Immigrants from Guyana (13.4%, a difference of 0.89%), German Russian (13.5%, a difference of 1.0%), and Immigrants from Burma/Myanmar (13.5%, a difference of 1.4%).
| Demographics | Rating | Rank | Master's Degree |
| Immigrants | Philippines | 6.0 /100 | #232 | Tragic 13.6% |
| Immigrants | Ecuador | 5.7 /100 | #233 | Tragic 13.6% |
| Immigrants | Burma/Myanmar | 5.0 /100 | #234 | Tragic 13.5% |
| German Russians | 4.5 /100 | #235 | Tragic 13.5% |
| Immigrants | Guyana | 4.4 /100 | #236 | Tragic 13.4% |
| Jamaicans | 4.1 /100 | #237 | Tragic 13.4% |
| Hmong | 4.0 /100 | #238 | Tragic 13.4% |
| Immigrants | Nonimmigrants | 3.4 /100 | #239 | Tragic 13.3% |
| Guamanians/Chamorros | 2.2 /100 | #240 | Tragic 13.1% |
| U.S. Virgin Islanders | 2.1 /100 | #241 | Tragic 13.1% |
| Spanish Americans | 1.9 /100 | #242 | Tragic 13.0% |
| Immigrants | Jamaica | 1.9 /100 | #243 | Tragic 13.0% |
| Delaware | 1.7 /100 | #244 | Tragic 13.0% |
| Immigrants | Bahamas | 1.4 /100 | #245 | Tragic 12.9% |
| Immigrants | Cambodia | 1.4 /100 | #246 | Tragic 12.9% |