Immigrants from Kuwait vs Immigrants from Asia Master's Degree
COMPARE
Immigrants from Kuwait
Immigrants from Asia
Master's Degree
Master's Degree Comparison
Immigrants from Kuwait
Immigrants from Asia
18.6%
MASTER'S DEGREE
100.0/ 100
METRIC RATING
52nd/ 347
METRIC RANK
18.4%
MASTER'S DEGREE
99.9/ 100
METRIC RATING
57th/ 347
METRIC RANK
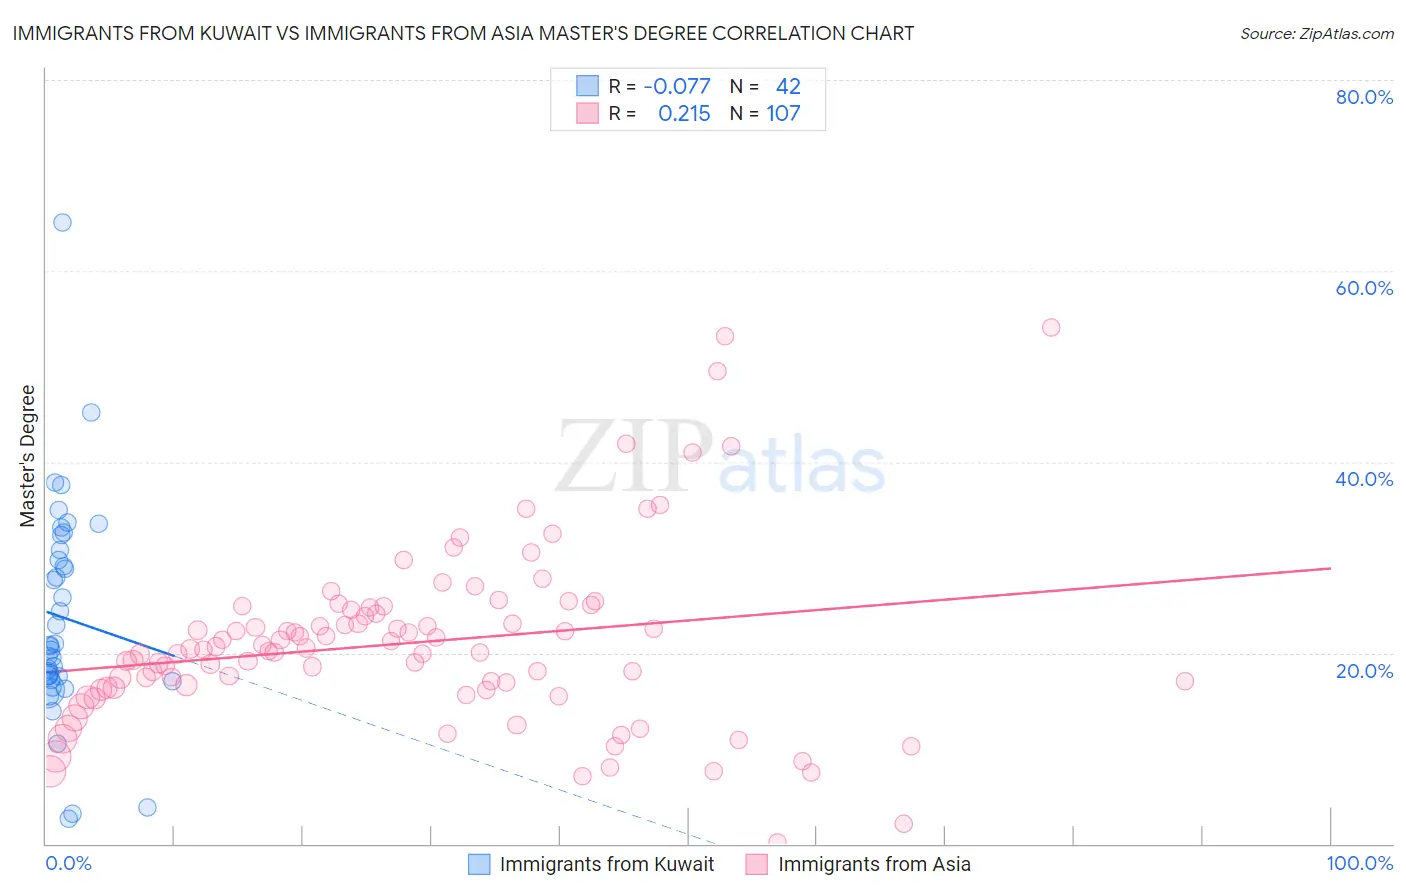
Immigrants from Kuwait vs Immigrants from Asia Master's Degree Correlation Chart
The statistical analysis conducted on geographies consisting of 136,916,630 people shows a slight negative correlation between the proportion of Immigrants from Kuwait and percentage of population with at least master's degree education in the United States with a correlation coefficient (R) of -0.077 and weighted average of 18.6%. Similarly, the statistical analysis conducted on geographies consisting of 548,687,564 people shows a weak positive correlation between the proportion of Immigrants from Asia and percentage of population with at least master's degree education in the United States with a correlation coefficient (R) of 0.215 and weighted average of 18.4%, a difference of 0.79%.
Master's Degree Correlation Summary
| Measurement | Immigrants from Kuwait | Immigrants from Asia |
| Minimum | 2.6% | 0.15% |
| Maximum | 65.1% | 54.1% |
| Range | 62.5% | 54.0% |
| Mean | 23.7% | 21.0% |
| Median | 20.7% | 20.3% |
| Interquartile 25% (IQ1) | 17.1% | 16.3% |
| Interquartile 75% (IQ3) | 30.8% | 24.5% |
| Interquartile Range (IQR) | 13.7% | 8.2% |
| Standard Deviation (Sample) | 11.5% | 9.2% |
| Standard Deviation (Population) | 11.4% | 9.2% |
Demographics Similar to Immigrants from Kuwait and Immigrants from Asia by Master's Degree
In terms of master's degree, the demographic groups most similar to Immigrants from Kuwait are Immigrants from Czechoslovakia (18.5%, a difference of 0.080%), Immigrants from Lithuania (18.5%, a difference of 0.39%), Immigrants from Serbia (18.5%, a difference of 0.42%), Asian (18.4%, a difference of 0.65%), and Australian (18.4%, a difference of 0.92%). Similarly, the demographic groups most similar to Immigrants from Asia are Australian (18.4%, a difference of 0.13%), Asian (18.4%, a difference of 0.14%), Immigrants from Serbia (18.5%, a difference of 0.36%), Immigrants from Lithuania (18.5%, a difference of 0.39%), and Immigrants from Bulgaria (18.3%, a difference of 0.57%).
| Demographics | Rating | Rank | Master's Degree |
| Immigrants | Malaysia | 100.0 /100 | #44 | Exceptional 18.9% |
| Immigrants | Belarus | 100.0 /100 | #45 | Exceptional 18.9% |
| Immigrants | Norway | 100.0 /100 | #46 | Exceptional 18.8% |
| Immigrants | Austria | 100.0 /100 | #47 | Exceptional 18.8% |
| Paraguayans | 100.0 /100 | #48 | Exceptional 18.8% |
| Estonians | 100.0 /100 | #49 | Exceptional 18.8% |
| Bulgarians | 100.0 /100 | #50 | Exceptional 18.8% |
| Immigrants | South Africa | 100.0 /100 | #51 | Exceptional 18.8% |
| Immigrants | Kuwait | 100.0 /100 | #52 | Exceptional 18.6% |
| Immigrants | Czechoslovakia | 99.9 /100 | #53 | Exceptional 18.5% |
| Immigrants | Lithuania | 99.9 /100 | #54 | Exceptional 18.5% |
| Immigrants | Serbia | 99.9 /100 | #55 | Exceptional 18.5% |
| Asians | 99.9 /100 | #56 | Exceptional 18.4% |
| Immigrants | Asia | 99.9 /100 | #57 | Exceptional 18.4% |
| Australians | 99.9 /100 | #58 | Exceptional 18.4% |
| Immigrants | Bulgaria | 99.9 /100 | #59 | Exceptional 18.3% |
| New Zealanders | 99.9 /100 | #60 | Exceptional 18.3% |
| Immigrants | Europe | 99.9 /100 | #61 | Exceptional 18.2% |
| Argentineans | 99.9 /100 | #62 | Exceptional 18.2% |
| Immigrants | Netherlands | 99.9 /100 | #63 | Exceptional 18.1% |
| South Africans | 99.9 /100 | #64 | Exceptional 18.1% |