Immigrants from Vietnam vs Immigrants from Bolivia Master's Degree
COMPARE
Immigrants from Vietnam
Immigrants from Bolivia
Master's Degree
Master's Degree Comparison
Immigrants from Vietnam
Immigrants from Bolivia
14.1%
MASTER'S DEGREE
16.1/ 100
METRIC RATING
215th/ 347
METRIC RANK
19.1%
MASTER'S DEGREE
100.0/ 100
METRIC RATING
40th/ 347
METRIC RANK
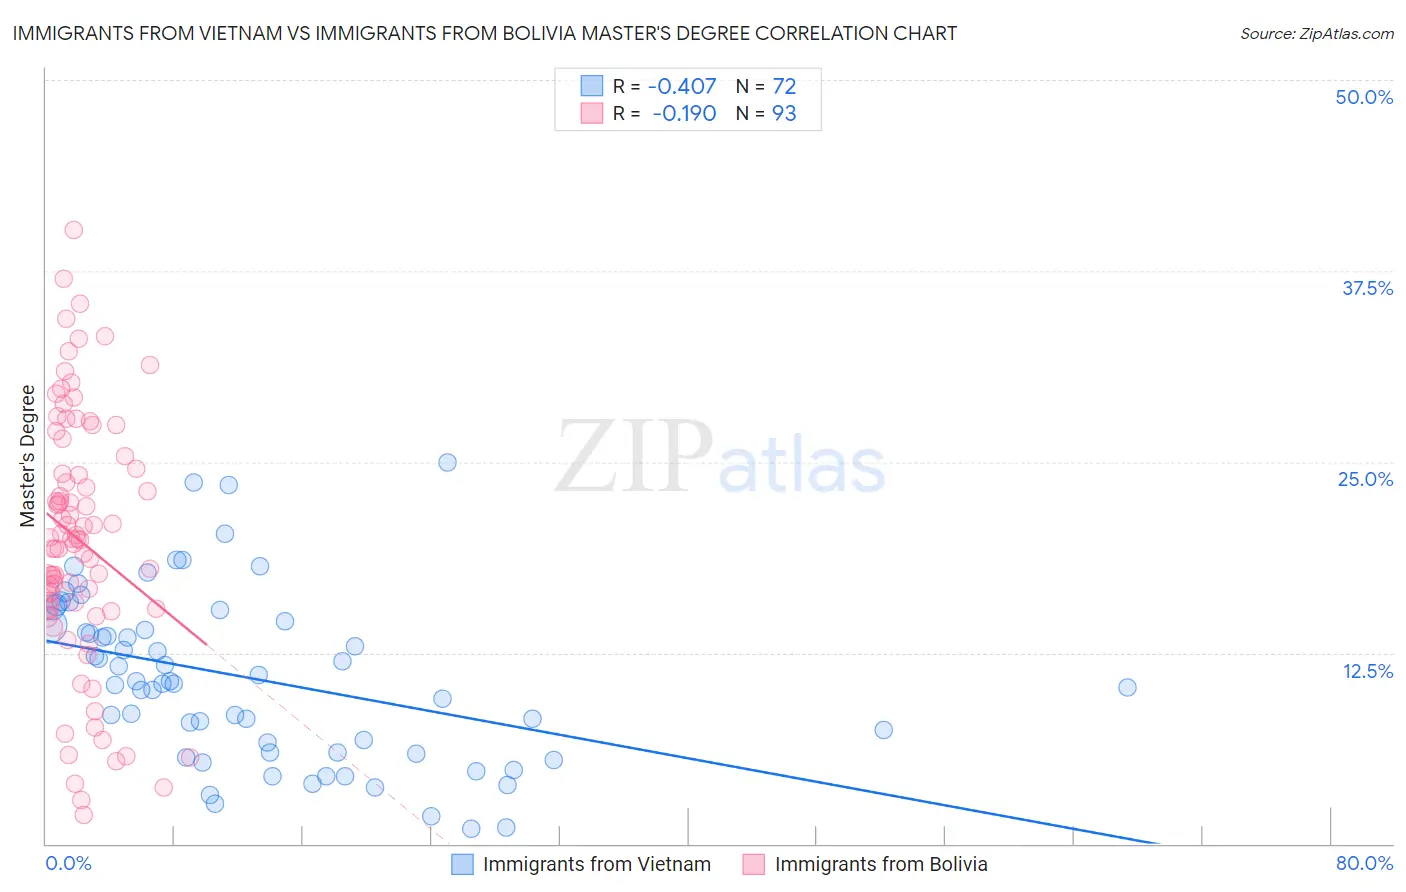
Immigrants from Vietnam vs Immigrants from Bolivia Master's Degree Correlation Chart
The statistical analysis conducted on geographies consisting of 404,720,080 people shows a moderate negative correlation between the proportion of Immigrants from Vietnam and percentage of population with at least master's degree education in the United States with a correlation coefficient (R) of -0.407 and weighted average of 14.1%. Similarly, the statistical analysis conducted on geographies consisting of 158,724,078 people shows a poor negative correlation between the proportion of Immigrants from Bolivia and percentage of population with at least master's degree education in the United States with a correlation coefficient (R) of -0.190 and weighted average of 19.1%, a difference of 35.3%.
Master's Degree Correlation Summary
| Measurement | Immigrants from Vietnam | Immigrants from Bolivia |
| Minimum | 0.99% | 1.9% |
| Maximum | 25.0% | 40.2% |
| Range | 24.0% | 38.3% |
| Mean | 10.8% | 19.9% |
| Median | 10.5% | 19.9% |
| Interquartile 25% (IQ1) | 6.0% | 15.5% |
| Interquartile 75% (IQ3) | 14.4% | 25.0% |
| Interquartile Range (IQR) | 8.5% | 9.5% |
| Standard Deviation (Sample) | 5.6% | 8.2% |
| Standard Deviation (Population) | 5.5% | 8.2% |
Similar Demographics by Master's Degree
Demographics Similar to Immigrants from Vietnam by Master's Degree
In terms of master's degree, the demographic groups most similar to Immigrants from Vietnam are Immigrants from Somalia (14.1%, a difference of 0.070%), Immigrants from Trinidad and Tobago (14.1%, a difference of 0.070%), Finnish (14.2%, a difference of 0.21%), Immigrants from Thailand (14.2%, a difference of 0.22%), and French Canadian (14.1%, a difference of 0.32%).
| Demographics | Rating | Rank | Master's Degree |
| Immigrants | Barbados | 20.5 /100 | #208 | Fair 14.3% |
| Immigrants | Panama | 20.0 /100 | #209 | Fair 14.3% |
| Sub-Saharan Africans | 19.4 /100 | #210 | Poor 14.2% |
| Somalis | 18.0 /100 | #211 | Poor 14.2% |
| Spanish | 17.8 /100 | #212 | Poor 14.2% |
| Immigrants | Thailand | 17.0 /100 | #213 | Poor 14.2% |
| Finns | 16.9 /100 | #214 | Poor 14.2% |
| Immigrants | Vietnam | 16.1 /100 | #215 | Poor 14.1% |
| Immigrants | Somalia | 15.8 /100 | #216 | Poor 14.1% |
| Immigrants | Trinidad and Tobago | 15.8 /100 | #217 | Poor 14.1% |
| French Canadians | 14.9 /100 | #218 | Poor 14.1% |
| Norwegians | 13.6 /100 | #219 | Poor 14.0% |
| Germans | 13.1 /100 | #220 | Poor 14.0% |
| Koreans | 12.7 /100 | #221 | Poor 14.0% |
| Ecuadorians | 12.6 /100 | #222 | Poor 14.0% |
Demographics Similar to Immigrants from Bolivia by Master's Degree
In terms of master's degree, the demographic groups most similar to Immigrants from Bolivia are Immigrants from Spain (19.1%, a difference of 0.13%), Immigrants from Latvia (19.1%, a difference of 0.35%), Bolivian (19.3%, a difference of 0.77%), Immigrants from Saudi Arabia (19.0%, a difference of 0.78%), and Immigrants from Greece (19.0%, a difference of 0.79%).
| Demographics | Rating | Rank | Master's Degree |
| Russians | 100.0 /100 | #33 | Exceptional 19.5% |
| Immigrants | Denmark | 100.0 /100 | #34 | Exceptional 19.5% |
| Immigrants | Northern Europe | 100.0 /100 | #35 | Exceptional 19.5% |
| Immigrants | Russia | 100.0 /100 | #36 | Exceptional 19.4% |
| Mongolians | 100.0 /100 | #37 | Exceptional 19.4% |
| Bolivians | 100.0 /100 | #38 | Exceptional 19.3% |
| Immigrants | Spain | 100.0 /100 | #39 | Exceptional 19.1% |
| Immigrants | Bolivia | 100.0 /100 | #40 | Exceptional 19.1% |
| Immigrants | Latvia | 100.0 /100 | #41 | Exceptional 19.1% |
| Immigrants | Saudi Arabia | 100.0 /100 | #42 | Exceptional 19.0% |
| Immigrants | Greece | 100.0 /100 | #43 | Exceptional 19.0% |
| Immigrants | Malaysia | 100.0 /100 | #44 | Exceptional 18.9% |
| Immigrants | Belarus | 100.0 /100 | #45 | Exceptional 18.9% |
| Immigrants | Norway | 100.0 /100 | #46 | Exceptional 18.8% |
| Immigrants | Austria | 100.0 /100 | #47 | Exceptional 18.8% |