Immigrants from Kenya vs Sierra Leonean College, 1 year or more
COMPARE
Immigrants from Kenya
Sierra Leonean
College, 1 year or more
College, 1 year or more Comparison
Immigrants from Kenya
Sierra Leoneans
60.5%
COLLEGE, 1 YEAR OR MORE
79.1/ 100
METRIC RATING
147th/ 347
METRIC RANK
60.2%
COLLEGE, 1 YEAR OR MORE
74.1/ 100
METRIC RATING
153rd/ 347
METRIC RANK
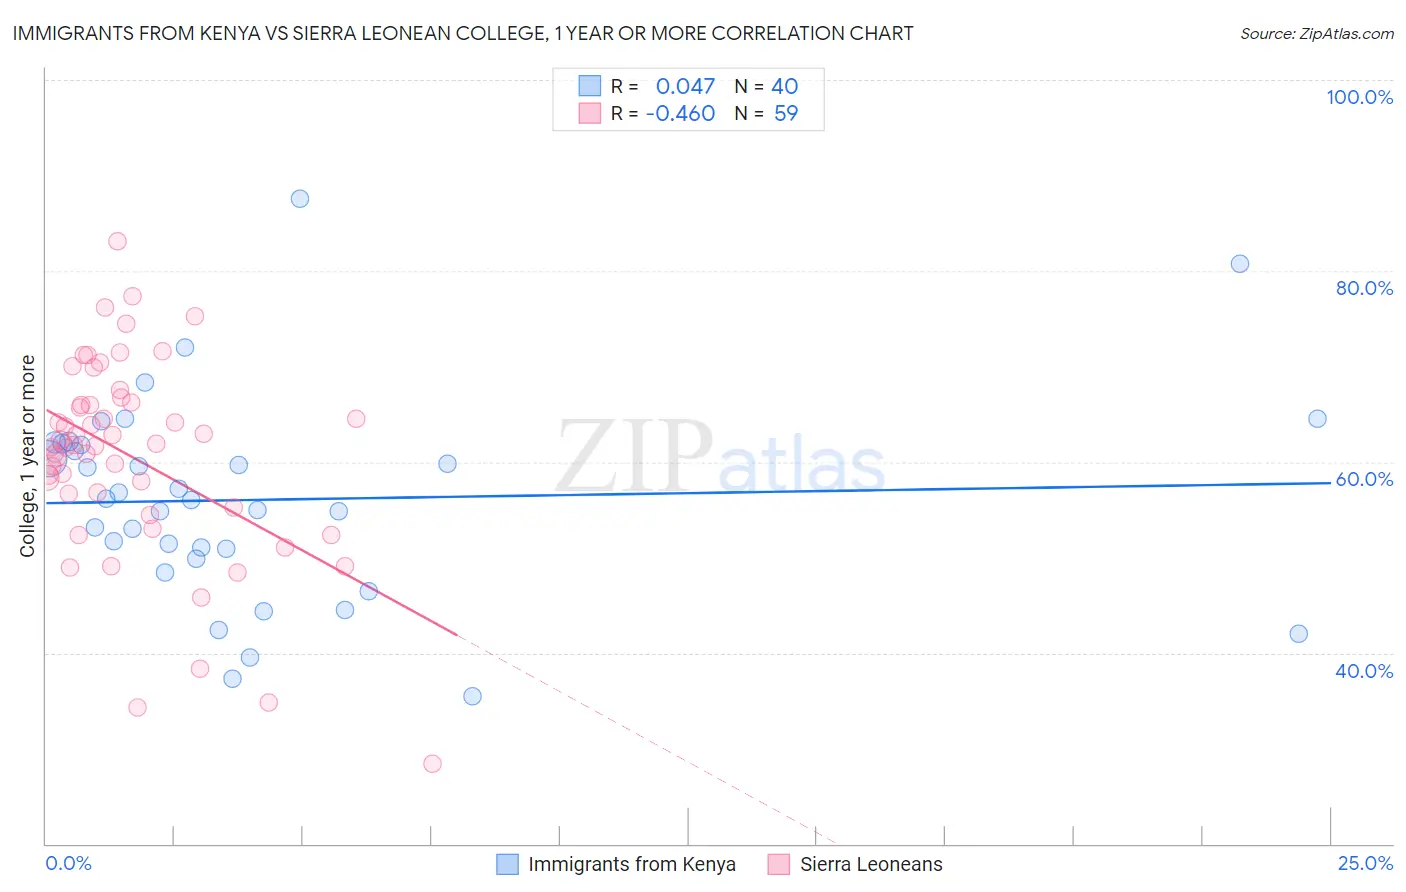
Immigrants from Kenya vs Sierra Leonean College, 1 year or more Correlation Chart
The statistical analysis conducted on geographies consisting of 218,085,582 people shows no correlation between the proportion of Immigrants from Kenya and percentage of population with at least college, 1 year or more education in the United States with a correlation coefficient (R) of 0.047 and weighted average of 60.5%. Similarly, the statistical analysis conducted on geographies consisting of 83,362,711 people shows a moderate negative correlation between the proportion of Sierra Leoneans and percentage of population with at least college, 1 year or more education in the United States with a correlation coefficient (R) of -0.460 and weighted average of 60.2%, a difference of 0.37%.
College, 1 year or more Correlation Summary
| Measurement | Immigrants from Kenya | Sierra Leonean |
| Minimum | 35.4% | 28.4% |
| Maximum | 87.6% | 83.1% |
| Range | 52.2% | 54.7% |
| Mean | 56.0% | 60.5% |
| Median | 56.0% | 61.8% |
| Interquartile 25% (IQ1) | 50.4% | 55.2% |
| Interquartile 75% (IQ3) | 61.8% | 66.2% |
| Interquartile Range (IQR) | 11.4% | 11.0% |
| Standard Deviation (Sample) | 10.7% | 10.6% |
| Standard Deviation (Population) | 10.6% | 10.5% |
Demographics Similar to Immigrants from Kenya and Sierra Leoneans by College, 1 year or more
In terms of college, 1 year or more, the demographic groups most similar to Immigrants from Kenya are Kenyan (60.5%, a difference of 0.010%), Brazilian (60.5%, a difference of 0.010%), Scottish (60.5%, a difference of 0.090%), Immigrants from Sudan (60.4%, a difference of 0.10%), and Albanian (60.4%, a difference of 0.10%). Similarly, the demographic groups most similar to Sierra Leoneans are Sudanese (60.2%, a difference of 0.080%), Moroccan (60.2%, a difference of 0.080%), Finnish (60.2%, a difference of 0.080%), Immigrants from Germany (60.3%, a difference of 0.14%), and Immigrants from Sudan (60.4%, a difference of 0.27%).
| Demographics | Rating | Rank | College, 1 year or more |
| Iraqis | 83.3 /100 | #140 | Excellent 60.7% |
| Immigrants | Afghanistan | 83.1 /100 | #141 | Excellent 60.7% |
| Poles | 82.8 /100 | #142 | Excellent 60.7% |
| Canadians | 82.7 /100 | #143 | Excellent 60.6% |
| Czechs | 81.9 /100 | #144 | Excellent 60.6% |
| Slavs | 81.1 /100 | #145 | Excellent 60.6% |
| Scottish | 80.2 /100 | #146 | Excellent 60.5% |
| Immigrants | Kenya | 79.1 /100 | #147 | Good 60.5% |
| Kenyans | 79.0 /100 | #148 | Good 60.5% |
| Brazilians | 79.0 /100 | #149 | Good 60.5% |
| Immigrants | Sudan | 77.8 /100 | #150 | Good 60.4% |
| Albanians | 77.8 /100 | #151 | Good 60.4% |
| Immigrants | Germany | 76.1 /100 | #152 | Good 60.3% |
| Sierra Leoneans | 74.1 /100 | #153 | Good 60.2% |
| Sudanese | 73.0 /100 | #154 | Good 60.2% |
| Moroccans | 72.9 /100 | #155 | Good 60.2% |
| Finns | 72.9 /100 | #156 | Good 60.2% |
| Immigrants | Armenia | 68.8 /100 | #157 | Good 60.0% |
| English | 67.2 /100 | #158 | Good 60.0% |
| Immigrants | Iraq | 67.0 /100 | #159 | Good 60.0% |
| South American Indians | 66.9 /100 | #160 | Good 60.0% |