Immigrants from Jordan vs Immigrants from Greece Householder Income Ages 45 - 64 years
COMPARE
Immigrants from Jordan
Immigrants from Greece
Householder Income Ages 45 - 64 years
Householder Income Ages 45 - 64 years Comparison
Immigrants from Jordan
Immigrants from Greece
$106,164
HOUSEHOLDER INCOME AGES 45 - 64 YEARS
94.9/ 100
METRIC RATING
119th/ 347
METRIC RANK
$113,548
HOUSEHOLDER INCOME AGES 45 - 64 YEARS
99.9/ 100
METRIC RATING
46th/ 347
METRIC RANK
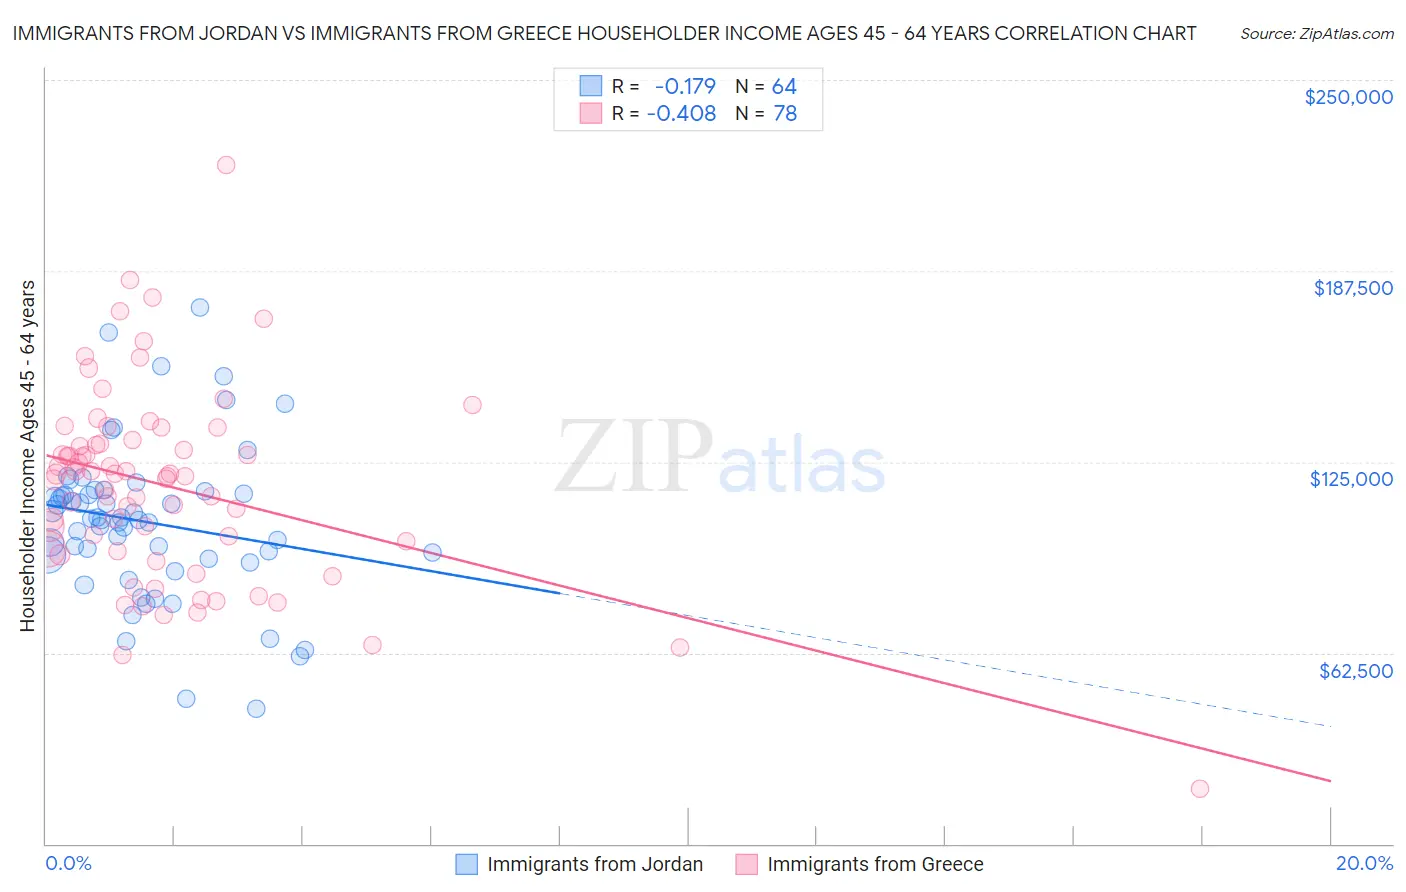
Immigrants from Jordan vs Immigrants from Greece Householder Income Ages 45 - 64 years Correlation Chart
The statistical analysis conducted on geographies consisting of 181,177,214 people shows a poor negative correlation between the proportion of Immigrants from Jordan and household income with householder between the ages 45 and 64 in the United States with a correlation coefficient (R) of -0.179 and weighted average of $106,164. Similarly, the statistical analysis conducted on geographies consisting of 216,803,825 people shows a moderate negative correlation between the proportion of Immigrants from Greece and household income with householder between the ages 45 and 64 in the United States with a correlation coefficient (R) of -0.408 and weighted average of $113,548, a difference of 7.0%.
Householder Income Ages 45 - 64 years Correlation Summary
| Measurement | Immigrants from Jordan | Immigrants from Greece |
| Minimum | $44,265 | $18,083 |
| Maximum | $175,361 | $222,000 |
| Range | $131,096 | $203,917 |
| Mean | $105,324 | $117,037 |
| Median | $106,275 | $120,719 |
| Interquartile 25% (IQ1) | $93,850 | $96,498 |
| Interquartile 75% (IQ3) | $114,914 | $131,127 |
| Interquartile Range (IQR) | $21,064 | $34,629 |
| Standard Deviation (Sample) | $25,270 | $31,775 |
| Standard Deviation (Population) | $25,072 | $31,571 |
Similar Demographics by Householder Income Ages 45 - 64 years
Demographics Similar to Immigrants from Jordan by Householder Income Ages 45 - 64 years
In terms of householder income ages 45 - 64 years, the demographic groups most similar to Immigrants from Jordan are Immigrants from Western Asia ($106,217, a difference of 0.050%), Immigrants from South Eastern Asia ($106,109, a difference of 0.050%), Albanian ($106,243, a difference of 0.070%), British ($106,264, a difference of 0.090%), and Immigrants from Kuwait ($106,285, a difference of 0.11%).
| Demographics | Rating | Rank | Householder Income Ages 45 - 64 years |
| Swedes | 95.4 /100 | #112 | Exceptional $106,377 |
| Europeans | 95.4 /100 | #113 | Exceptional $106,367 |
| Immigrants | Poland | 95.3 /100 | #114 | Exceptional $106,319 |
| Immigrants | Kuwait | 95.2 /100 | #115 | Exceptional $106,285 |
| British | 95.2 /100 | #116 | Exceptional $106,264 |
| Albanians | 95.1 /100 | #117 | Exceptional $106,243 |
| Immigrants | Western Asia | 95.0 /100 | #118 | Exceptional $106,217 |
| Immigrants | Jordan | 94.9 /100 | #119 | Exceptional $106,164 |
| Immigrants | South Eastern Asia | 94.8 /100 | #120 | Exceptional $106,109 |
| Poles | 94.4 /100 | #121 | Exceptional $105,952 |
| Immigrants | North Macedonia | 94.2 /100 | #122 | Exceptional $105,892 |
| Danes | 93.4 /100 | #123 | Exceptional $105,619 |
| Immigrants | Northern Africa | 92.8 /100 | #124 | Exceptional $105,430 |
| Pakistanis | 92.4 /100 | #125 | Exceptional $105,317 |
| Portuguese | 92.4 /100 | #126 | Exceptional $105,309 |
Demographics Similar to Immigrants from Greece by Householder Income Ages 45 - 64 years
In terms of householder income ages 45 - 64 years, the demographic groups most similar to Immigrants from Greece are Australian ($113,533, a difference of 0.010%), Immigrants from Indonesia ($113,519, a difference of 0.030%), Immigrants from France ($113,680, a difference of 0.12%), Bulgarian ($113,883, a difference of 0.29%), and Immigrants from Russia ($113,215, a difference of 0.29%).
| Demographics | Rating | Rank | Householder Income Ages 45 - 64 years |
| Immigrants | Turkey | 99.9 /100 | #39 | Exceptional $114,407 |
| Cambodians | 99.9 /100 | #40 | Exceptional $114,342 |
| Immigrants | Lithuania | 99.9 /100 | #41 | Exceptional $114,336 |
| Estonians | 99.9 /100 | #42 | Exceptional $114,220 |
| Israelis | 99.9 /100 | #43 | Exceptional $114,186 |
| Bulgarians | 99.9 /100 | #44 | Exceptional $113,883 |
| Immigrants | France | 99.9 /100 | #45 | Exceptional $113,680 |
| Immigrants | Greece | 99.9 /100 | #46 | Exceptional $113,548 |
| Australians | 99.9 /100 | #47 | Exceptional $113,533 |
| Immigrants | Indonesia | 99.9 /100 | #48 | Exceptional $113,519 |
| Immigrants | Russia | 99.8 /100 | #49 | Exceptional $113,215 |
| Immigrants | Austria | 99.8 /100 | #50 | Exceptional $113,140 |
| Immigrants | South Africa | 99.8 /100 | #51 | Exceptional $112,886 |
| Immigrants | Malaysia | 99.8 /100 | #52 | Exceptional $112,796 |
| Afghans | 99.8 /100 | #53 | Exceptional $112,676 |