Immigrants from Jamaica vs European Master's Degree
COMPARE
Immigrants from Jamaica
European
Master's Degree
Master's Degree Comparison
Immigrants from Jamaica
Europeans
13.0%
MASTER'S DEGREE
1.9/ 100
METRIC RATING
243rd/ 347
METRIC RANK
15.8%
MASTER'S DEGREE
86.4/ 100
METRIC RATING
137th/ 347
METRIC RANK
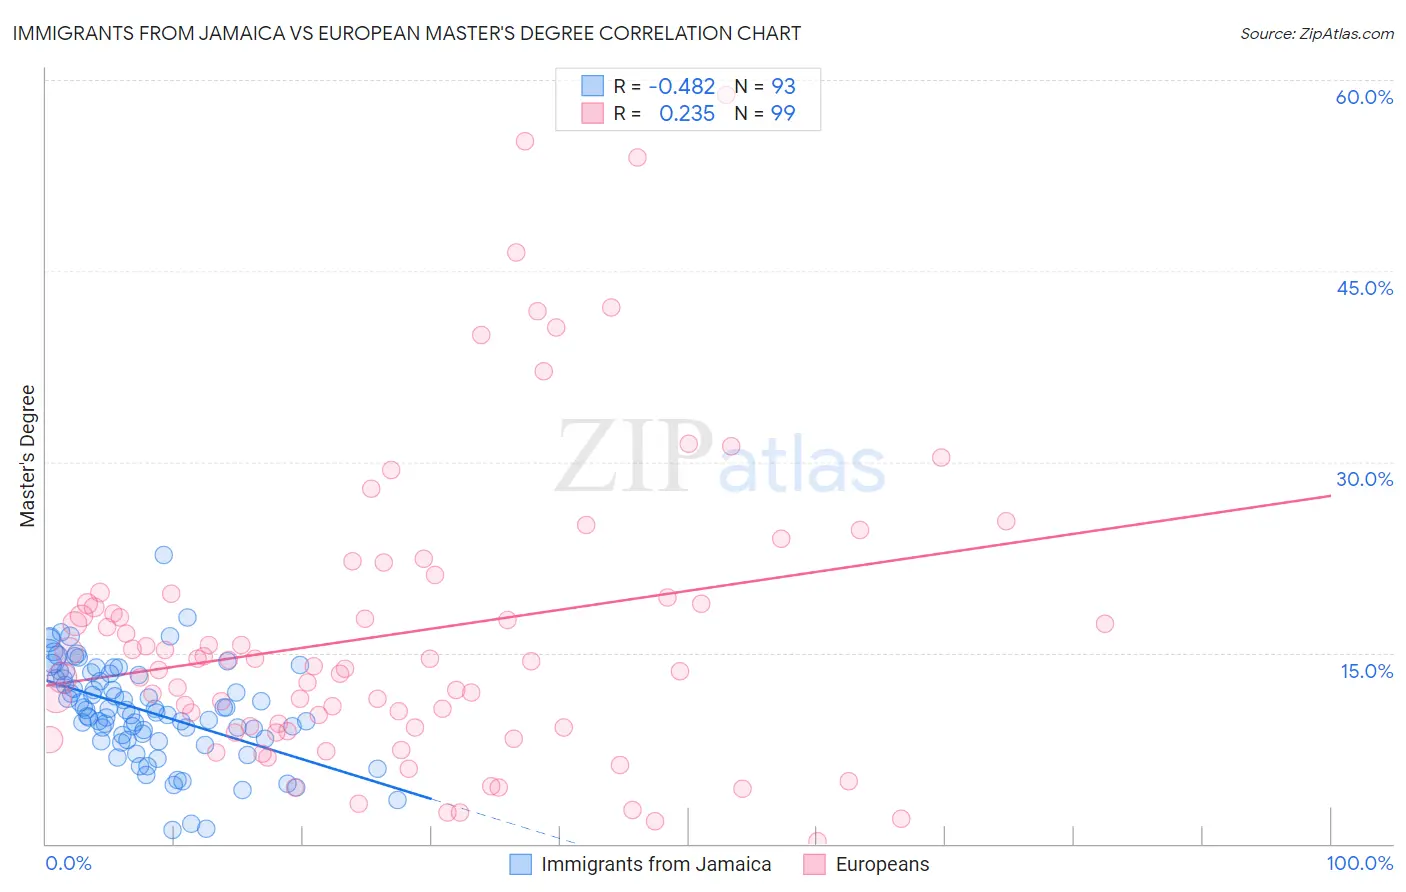
Immigrants from Jamaica vs European Master's Degree Correlation Chart
The statistical analysis conducted on geographies consisting of 301,740,066 people shows a moderate negative correlation between the proportion of Immigrants from Jamaica and percentage of population with at least master's degree education in the United States with a correlation coefficient (R) of -0.482 and weighted average of 13.0%. Similarly, the statistical analysis conducted on geographies consisting of 561,170,396 people shows a weak positive correlation between the proportion of Europeans and percentage of population with at least master's degree education in the United States with a correlation coefficient (R) of 0.235 and weighted average of 15.8%, a difference of 21.2%.
Master's Degree Correlation Summary
| Measurement | Immigrants from Jamaica | European |
| Minimum | 1.1% | 0.22% |
| Maximum | 22.6% | 58.8% |
| Range | 21.5% | 58.6% |
| Mean | 10.4% | 16.5% |
| Median | 10.5% | 13.9% |
| Interquartile 25% (IQ1) | 8.2% | 9.1% |
| Interquartile 75% (IQ3) | 13.3% | 19.4% |
| Interquartile Range (IQR) | 5.1% | 10.3% |
| Standard Deviation (Sample) | 3.8% | 11.8% |
| Standard Deviation (Population) | 3.8% | 11.8% |
Similar Demographics by Master's Degree
Demographics Similar to Immigrants from Jamaica by Master's Degree
In terms of master's degree, the demographic groups most similar to Immigrants from Jamaica are Spanish American (13.0%, a difference of 0.040%), U.S. Virgin Islander (13.1%, a difference of 0.32%), Delaware (13.0%, a difference of 0.38%), Guamanian/Chamorro (13.1%, a difference of 0.47%), and Immigrants from Bahamas (12.9%, a difference of 1.0%).
| Demographics | Rating | Rank | Master's Degree |
| Immigrants | Guyana | 4.4 /100 | #236 | Tragic 13.4% |
| Jamaicans | 4.1 /100 | #237 | Tragic 13.4% |
| Hmong | 4.0 /100 | #238 | Tragic 13.4% |
| Immigrants | Nonimmigrants | 3.4 /100 | #239 | Tragic 13.3% |
| Guamanians/Chamorros | 2.2 /100 | #240 | Tragic 13.1% |
| U.S. Virgin Islanders | 2.1 /100 | #241 | Tragic 13.1% |
| Spanish Americans | 1.9 /100 | #242 | Tragic 13.0% |
| Immigrants | Jamaica | 1.9 /100 | #243 | Tragic 13.0% |
| Delaware | 1.7 /100 | #244 | Tragic 13.0% |
| Immigrants | Bahamas | 1.4 /100 | #245 | Tragic 12.9% |
| Immigrants | Cambodia | 1.4 /100 | #246 | Tragic 12.9% |
| Iroquois | 1.4 /100 | #247 | Tragic 12.9% |
| Africans | 1.4 /100 | #248 | Tragic 12.9% |
| Cree | 1.3 /100 | #249 | Tragic 12.8% |
| Liberians | 1.3 /100 | #250 | Tragic 12.8% |
Demographics Similar to Europeans by Master's Degree
In terms of master's degree, the demographic groups most similar to Europeans are Pakistani (15.8%, a difference of 0.080%), Assyrian/Chaldean/Syriac (15.8%, a difference of 0.10%), Immigrants from Germany (15.8%, a difference of 0.14%), Vietnamese (15.8%, a difference of 0.22%), and Polish (15.7%, a difference of 0.35%).
| Demographics | Rating | Rank | Master's Degree |
| Immigrants | Jordan | 92.7 /100 | #130 | Exceptional 16.1% |
| Taiwanese | 91.9 /100 | #131 | Exceptional 16.1% |
| Serbians | 91.7 /100 | #132 | Exceptional 16.1% |
| Immigrants | Sudan | 90.2 /100 | #133 | Exceptional 16.0% |
| Venezuelans | 88.4 /100 | #134 | Excellent 15.9% |
| South American Indians | 88.4 /100 | #135 | Excellent 15.9% |
| Assyrians/Chaldeans/Syriacs | 86.8 /100 | #136 | Excellent 15.8% |
| Europeans | 86.4 /100 | #137 | Excellent 15.8% |
| Pakistanis | 86.1 /100 | #138 | Excellent 15.8% |
| Immigrants | Germany | 85.9 /100 | #139 | Excellent 15.8% |
| Vietnamese | 85.5 /100 | #140 | Excellent 15.8% |
| Poles | 85.0 /100 | #141 | Excellent 15.7% |
| Immigrants | Africa | 84.0 /100 | #142 | Excellent 15.7% |
| Immigrants | Venezuela | 83.6 /100 | #143 | Excellent 15.7% |
| Canadians | 83.3 /100 | #144 | Excellent 15.7% |