Immigrants from Jamaica vs Cree Master's Degree
COMPARE
Immigrants from Jamaica
Cree
Master's Degree
Master's Degree Comparison
Immigrants from Jamaica
Cree
13.0%
MASTER'S DEGREE
1.9/ 100
METRIC RATING
243rd/ 347
METRIC RANK
12.8%
MASTER'S DEGREE
1.3/ 100
METRIC RATING
249th/ 347
METRIC RANK
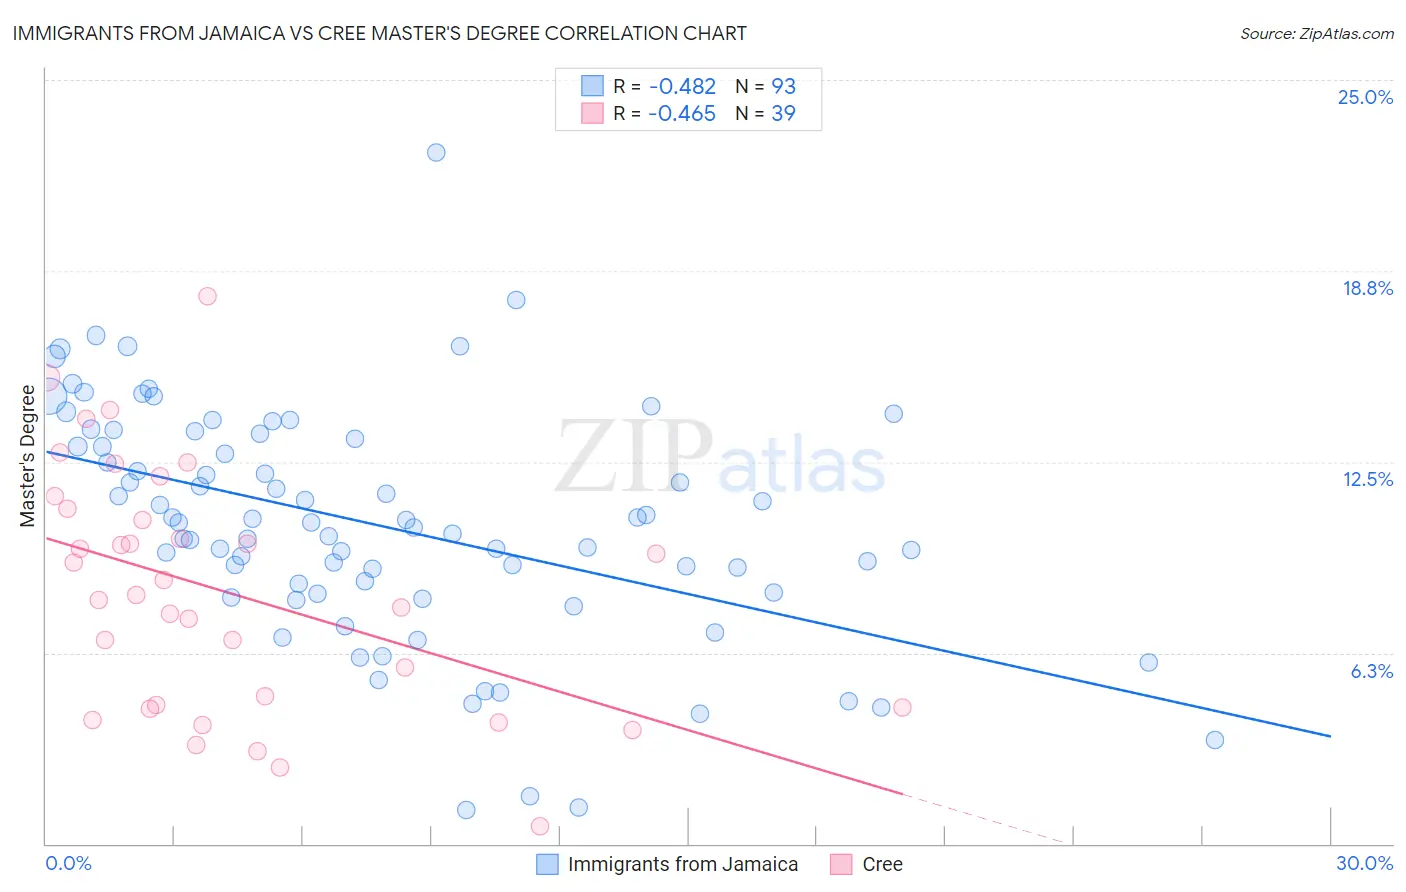
Immigrants from Jamaica vs Cree Master's Degree Correlation Chart
The statistical analysis conducted on geographies consisting of 301,740,066 people shows a moderate negative correlation between the proportion of Immigrants from Jamaica and percentage of population with at least master's degree education in the United States with a correlation coefficient (R) of -0.482 and weighted average of 13.0%. Similarly, the statistical analysis conducted on geographies consisting of 76,203,743 people shows a moderate negative correlation between the proportion of Cree and percentage of population with at least master's degree education in the United States with a correlation coefficient (R) of -0.465 and weighted average of 12.8%, a difference of 1.5%.
Master's Degree Correlation Summary
| Measurement | Immigrants from Jamaica | Cree |
| Minimum | 1.1% | 0.59% |
| Maximum | 22.6% | 17.9% |
| Range | 21.5% | 17.3% |
| Mean | 10.4% | 8.2% |
| Median | 10.5% | 8.1% |
| Interquartile 25% (IQ1) | 8.2% | 4.4% |
| Interquartile 75% (IQ3) | 13.3% | 11.0% |
| Interquartile Range (IQR) | 5.1% | 6.5% |
| Standard Deviation (Sample) | 3.8% | 4.0% |
| Standard Deviation (Population) | 3.8% | 3.9% |
Demographics Similar to Immigrants from Jamaica and Cree by Master's Degree
In terms of master's degree, the demographic groups most similar to Immigrants from Jamaica are Spanish American (13.0%, a difference of 0.040%), U.S. Virgin Islander (13.1%, a difference of 0.32%), Delaware (13.0%, a difference of 0.38%), Guamanian/Chamorro (13.1%, a difference of 0.47%), and Immigrants from Bahamas (12.9%, a difference of 1.0%). Similarly, the demographic groups most similar to Cree are Liberian (12.8%, a difference of 0.010%), Tlingit-Haida (12.8%, a difference of 0.040%), African (12.9%, a difference of 0.31%), Iroquois (12.9%, a difference of 0.40%), and Immigrants from Cambodia (12.9%, a difference of 0.43%).
| Demographics | Rating | Rank | Master's Degree |
| Immigrants | Guyana | 4.4 /100 | #236 | Tragic 13.4% |
| Jamaicans | 4.1 /100 | #237 | Tragic 13.4% |
| Hmong | 4.0 /100 | #238 | Tragic 13.4% |
| Immigrants | Nonimmigrants | 3.4 /100 | #239 | Tragic 13.3% |
| Guamanians/Chamorros | 2.2 /100 | #240 | Tragic 13.1% |
| U.S. Virgin Islanders | 2.1 /100 | #241 | Tragic 13.1% |
| Spanish Americans | 1.9 /100 | #242 | Tragic 13.0% |
| Immigrants | Jamaica | 1.9 /100 | #243 | Tragic 13.0% |
| Delaware | 1.7 /100 | #244 | Tragic 13.0% |
| Immigrants | Bahamas | 1.4 /100 | #245 | Tragic 12.9% |
| Immigrants | Cambodia | 1.4 /100 | #246 | Tragic 12.9% |
| Iroquois | 1.4 /100 | #247 | Tragic 12.9% |
| Africans | 1.4 /100 | #248 | Tragic 12.9% |
| Cree | 1.3 /100 | #249 | Tragic 12.8% |
| Liberians | 1.3 /100 | #250 | Tragic 12.8% |
| Tlingit-Haida | 1.3 /100 | #251 | Tragic 12.8% |
| French American Indians | 1.0 /100 | #252 | Tragic 12.7% |
| Immigrants | Dominica | 0.8 /100 | #253 | Tragic 12.6% |
| Indonesians | 0.8 /100 | #254 | Tragic 12.6% |
| Immigrants | Congo | 0.8 /100 | #255 | Tragic 12.6% |
| Immigrants | Portugal | 0.8 /100 | #256 | Tragic 12.6% |