Immigrants from Jamaica vs Sudanese Master's Degree
COMPARE
Immigrants from Jamaica
Sudanese
Master's Degree
Master's Degree Comparison
Immigrants from Jamaica
Sudanese
13.0%
MASTER'S DEGREE
1.9/ 100
METRIC RATING
243rd/ 347
METRIC RANK
15.3%
MASTER'S DEGREE
68.7/ 100
METRIC RATING
161st/ 347
METRIC RANK
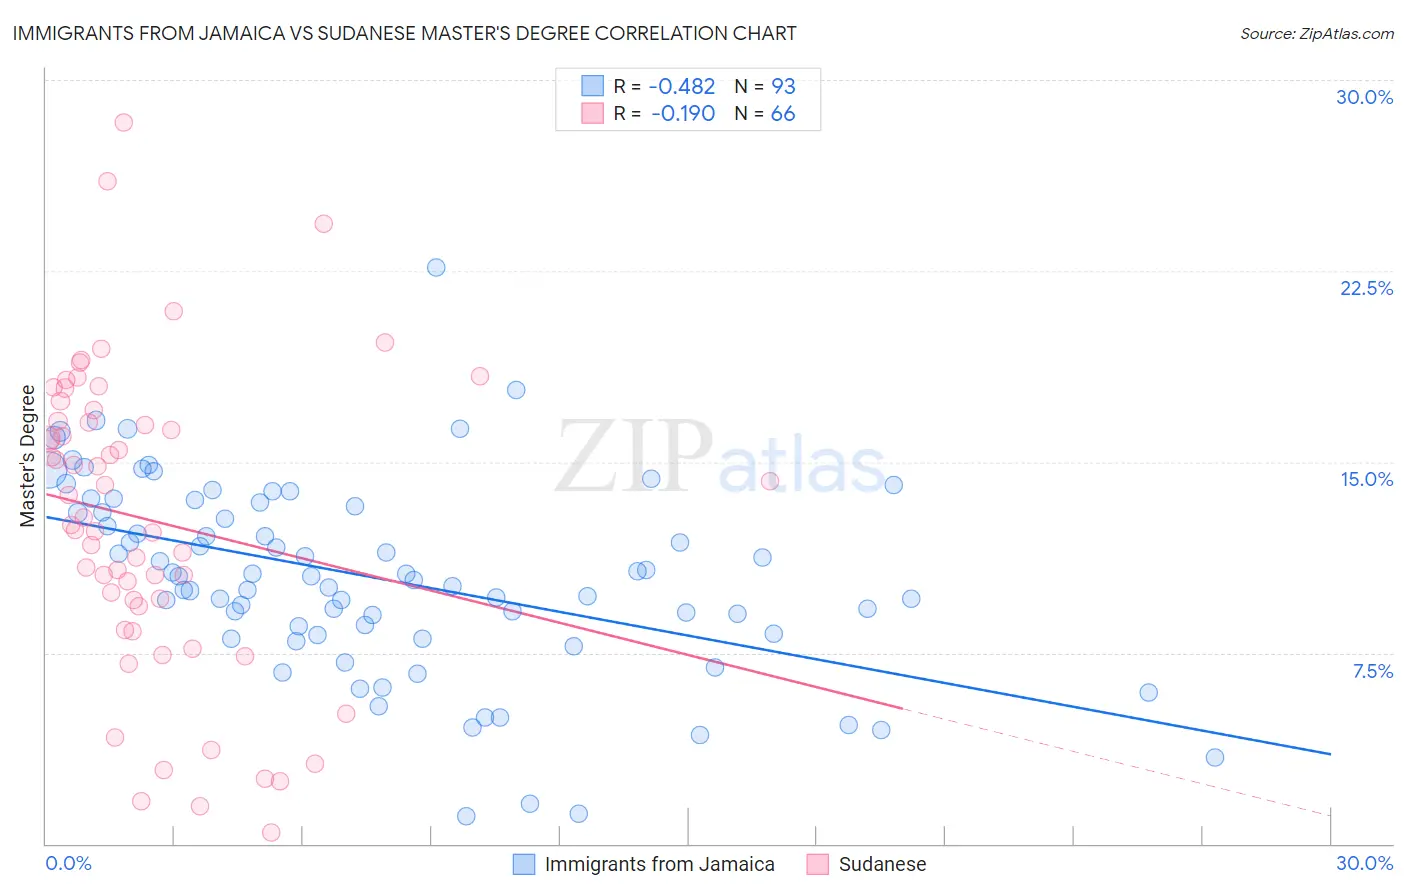
Immigrants from Jamaica vs Sudanese Master's Degree Correlation Chart
The statistical analysis conducted on geographies consisting of 301,740,066 people shows a moderate negative correlation between the proportion of Immigrants from Jamaica and percentage of population with at least master's degree education in the United States with a correlation coefficient (R) of -0.482 and weighted average of 13.0%. Similarly, the statistical analysis conducted on geographies consisting of 110,110,663 people shows a poor negative correlation between the proportion of Sudanese and percentage of population with at least master's degree education in the United States with a correlation coefficient (R) of -0.190 and weighted average of 15.3%, a difference of 17.3%.
Master's Degree Correlation Summary
| Measurement | Immigrants from Jamaica | Sudanese |
| Minimum | 1.1% | 0.44% |
| Maximum | 22.6% | 28.3% |
| Range | 21.5% | 27.9% |
| Mean | 10.4% | 12.7% |
| Median | 10.5% | 12.7% |
| Interquartile 25% (IQ1) | 8.2% | 9.3% |
| Interquartile 75% (IQ3) | 13.3% | 16.6% |
| Interquartile Range (IQR) | 5.1% | 7.3% |
| Standard Deviation (Sample) | 3.8% | 6.0% |
| Standard Deviation (Population) | 3.8% | 6.0% |
Similar Demographics by Master's Degree
Demographics Similar to Immigrants from Jamaica by Master's Degree
In terms of master's degree, the demographic groups most similar to Immigrants from Jamaica are Spanish American (13.0%, a difference of 0.040%), U.S. Virgin Islander (13.1%, a difference of 0.32%), Delaware (13.0%, a difference of 0.38%), Guamanian/Chamorro (13.1%, a difference of 0.47%), and Immigrants from Bahamas (12.9%, a difference of 1.0%).
| Demographics | Rating | Rank | Master's Degree |
| Immigrants | Guyana | 4.4 /100 | #236 | Tragic 13.4% |
| Jamaicans | 4.1 /100 | #237 | Tragic 13.4% |
| Hmong | 4.0 /100 | #238 | Tragic 13.4% |
| Immigrants | Nonimmigrants | 3.4 /100 | #239 | Tragic 13.3% |
| Guamanians/Chamorros | 2.2 /100 | #240 | Tragic 13.1% |
| U.S. Virgin Islanders | 2.1 /100 | #241 | Tragic 13.1% |
| Spanish Americans | 1.9 /100 | #242 | Tragic 13.0% |
| Immigrants | Jamaica | 1.9 /100 | #243 | Tragic 13.0% |
| Delaware | 1.7 /100 | #244 | Tragic 13.0% |
| Immigrants | Bahamas | 1.4 /100 | #245 | Tragic 12.9% |
| Immigrants | Cambodia | 1.4 /100 | #246 | Tragic 12.9% |
| Iroquois | 1.4 /100 | #247 | Tragic 12.9% |
| Africans | 1.4 /100 | #248 | Tragic 12.9% |
| Cree | 1.3 /100 | #249 | Tragic 12.8% |
| Liberians | 1.3 /100 | #250 | Tragic 12.8% |
Demographics Similar to Sudanese by Master's Degree
In terms of master's degree, the demographic groups most similar to Sudanese are Peruvian (15.3%, a difference of 0.010%), Kenyan (15.3%, a difference of 0.23%), Uruguayan (15.3%, a difference of 0.23%), Colombian (15.3%, a difference of 0.26%), and Immigrants from Kenya (15.3%, a difference of 0.30%).
| Demographics | Rating | Rank | Master's Degree |
| Immigrants | South America | 76.3 /100 | #154 | Good 15.5% |
| Immigrants | Bangladesh | 76.1 /100 | #155 | Good 15.5% |
| Bermudans | 73.9 /100 | #156 | Good 15.4% |
| Immigrants | Cameroon | 71.7 /100 | #157 | Good 15.4% |
| Immigrants | Poland | 71.5 /100 | #158 | Good 15.4% |
| Luxembourgers | 71.0 /100 | #159 | Good 15.3% |
| Kenyans | 70.3 /100 | #160 | Good 15.3% |
| Sudanese | 68.7 /100 | #161 | Good 15.3% |
| Peruvians | 68.7 /100 | #162 | Good 15.3% |
| Uruguayans | 67.1 /100 | #163 | Good 15.3% |
| Colombians | 66.9 /100 | #164 | Good 15.3% |
| Immigrants | Kenya | 66.6 /100 | #165 | Good 15.3% |
| Swedes | 66.1 /100 | #166 | Good 15.2% |
| Senegalese | 65.6 /100 | #167 | Good 15.2% |
| Immigrants | North Macedonia | 64.5 /100 | #168 | Good 15.2% |