Immigrants from Israel vs Hopi No Schooling Completed
COMPARE
Immigrants from Israel
Hopi
No Schooling Completed
No Schooling Completed Comparison
Immigrants from Israel
Hopi
2.0%
NO SCHOOLING COMPLETED
85.4/ 100
METRIC RATING
138th/ 347
METRIC RANK
2.2%
NO SCHOOLING COMPLETED
12.9/ 100
METRIC RATING
204th/ 347
METRIC RANK
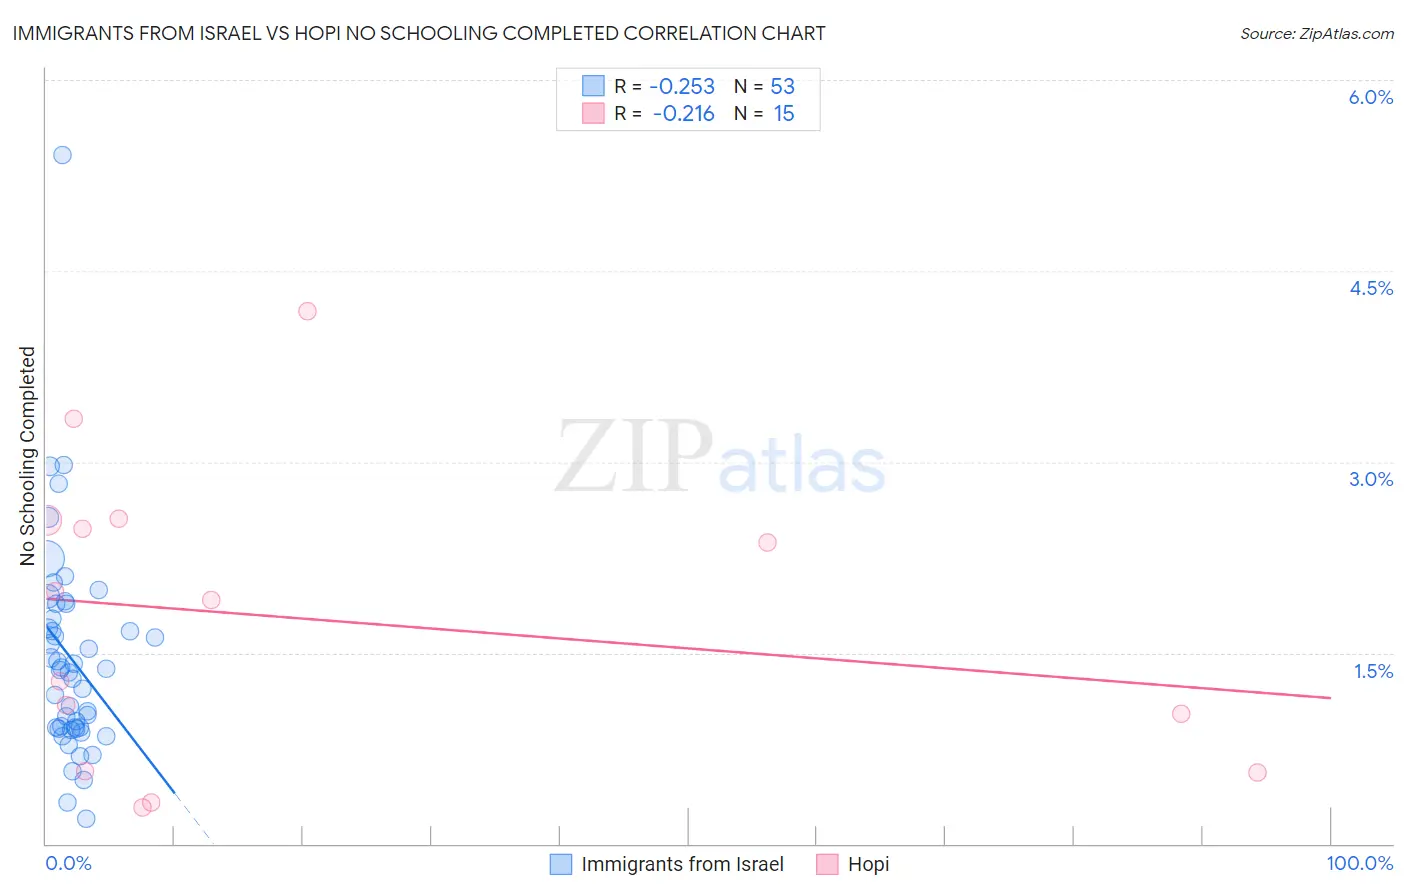
Immigrants from Israel vs Hopi No Schooling Completed Correlation Chart
The statistical analysis conducted on geographies consisting of 208,773,041 people shows a weak negative correlation between the proportion of Immigrants from Israel and percentage of population with no schooling in the United States with a correlation coefficient (R) of -0.253 and weighted average of 2.0%. Similarly, the statistical analysis conducted on geographies consisting of 74,568,063 people shows a weak negative correlation between the proportion of Hopi and percentage of population with no schooling in the United States with a correlation coefficient (R) of -0.216 and weighted average of 2.2%, a difference of 13.1%.
No Schooling Completed Correlation Summary
| Measurement | Immigrants from Israel | Hopi |
| Minimum | 0.20% | 0.29% |
| Maximum | 5.4% | 4.2% |
| Range | 5.2% | 3.9% |
| Mean | 1.5% | 1.8% |
| Median | 1.4% | 1.9% |
| Interquartile 25% (IQ1) | 0.91% | 0.57% |
| Interquartile 75% (IQ3) | 1.8% | 2.5% |
| Interquartile Range (IQR) | 0.92% | 2.0% |
| Standard Deviation (Sample) | 0.84% | 1.2% |
| Standard Deviation (Population) | 0.83% | 1.1% |
Similar Demographics by No Schooling Completed
Demographics Similar to Immigrants from Israel by No Schooling Completed
In terms of no schooling completed, the demographic groups most similar to Immigrants from Israel are Filipino (2.0%, a difference of 0.030%), Jordanian (2.0%, a difference of 0.25%), Marshallese (2.0%, a difference of 0.51%), Immigrants from Greece (2.0%, a difference of 0.52%), and Burmese (1.9%, a difference of 0.89%).
| Demographics | Rating | Rank | No Schooling Completed |
| Immigrants | Hungary | 91.6 /100 | #131 | Exceptional 1.9% |
| Colville | 90.4 /100 | #132 | Exceptional 1.9% |
| Immigrants | Turkey | 90.2 /100 | #133 | Exceptional 1.9% |
| Menominee | 89.6 /100 | #134 | Excellent 1.9% |
| Hmong | 88.5 /100 | #135 | Excellent 1.9% |
| Burmese | 88.2 /100 | #136 | Excellent 1.9% |
| Filipinos | 85.5 /100 | #137 | Excellent 2.0% |
| Immigrants | Israel | 85.4 /100 | #138 | Excellent 2.0% |
| Jordanians | 84.5 /100 | #139 | Excellent 2.0% |
| Marshallese | 83.5 /100 | #140 | Excellent 2.0% |
| Immigrants | Greece | 83.5 /100 | #141 | Excellent 2.0% |
| Venezuelans | 81.5 /100 | #142 | Excellent 2.0% |
| Immigrants | South Central Asia | 80.0 /100 | #143 | Good 2.0% |
| Alsatians | 79.1 /100 | #144 | Good 2.0% |
| Immigrants | Iran | 79.0 /100 | #145 | Good 2.0% |
Demographics Similar to Hopi by No Schooling Completed
In terms of no schooling completed, the demographic groups most similar to Hopi are Laotian (2.2%, a difference of 0.11%), Moroccan (2.2%, a difference of 0.22%), Immigrants from Bahamas (2.2%, a difference of 0.40%), Bahamian (2.2%, a difference of 0.41%), and South American Indian (2.2%, a difference of 0.59%).
| Demographics | Rating | Rank | No Schooling Completed |
| Immigrants | Southern Europe | 23.8 /100 | #197 | Fair 2.2% |
| Immigrants | Chile | 22.7 /100 | #198 | Fair 2.2% |
| Africans | 21.8 /100 | #199 | Fair 2.2% |
| Immigrants | Northern Africa | 19.5 /100 | #200 | Poor 2.2% |
| Costa Ricans | 17.1 /100 | #201 | Poor 2.2% |
| Moroccans | 13.7 /100 | #202 | Poor 2.2% |
| Laotians | 13.3 /100 | #203 | Poor 2.2% |
| Hopi | 12.9 /100 | #204 | Poor 2.2% |
| Immigrants | Bahamas | 11.6 /100 | #205 | Poor 2.2% |
| Bahamians | 11.6 /100 | #206 | Poor 2.2% |
| South American Indians | 11.0 /100 | #207 | Poor 2.2% |
| Uruguayans | 11.0 /100 | #208 | Poor 2.2% |
| Immigrants | Oceania | 10.2 /100 | #209 | Poor 2.2% |
| Natives/Alaskans | 10.0 /100 | #210 | Tragic 2.2% |
| Immigrants | Panama | 8.8 /100 | #211 | Tragic 2.3% |