Immigrants from Iraq vs Houma High School Diploma
COMPARE
Immigrants from Iraq
Houma
High School Diploma
High School Diploma Comparison
Immigrants from Iraq
Houma
89.4%
HIGH SCHOOL DIPLOMA
68.7/ 100
METRIC RATING
153rd/ 347
METRIC RANK
81.5%
HIGH SCHOOL DIPLOMA
0.0/ 100
METRIC RATING
340th/ 347
METRIC RANK
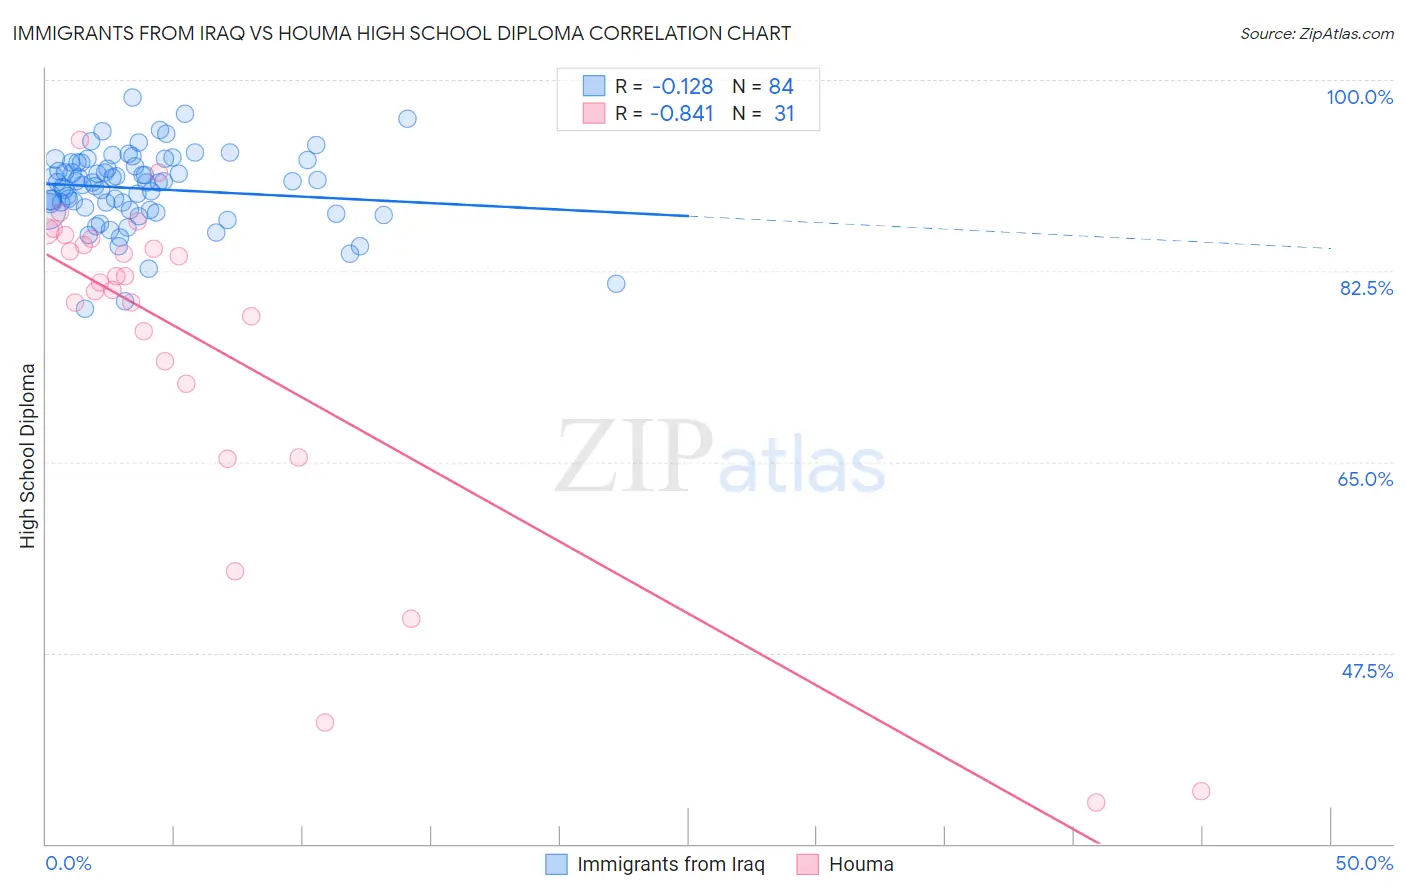
Immigrants from Iraq vs Houma High School Diploma Correlation Chart
The statistical analysis conducted on geographies consisting of 194,726,982 people shows a poor negative correlation between the proportion of Immigrants from Iraq and percentage of population with at least high school diploma education in the United States with a correlation coefficient (R) of -0.128 and weighted average of 89.4%. Similarly, the statistical analysis conducted on geographies consisting of 36,795,916 people shows a very strong negative correlation between the proportion of Houma and percentage of population with at least high school diploma education in the United States with a correlation coefficient (R) of -0.841 and weighted average of 81.5%, a difference of 9.7%.
High School Diploma Correlation Summary
| Measurement | Immigrants from Iraq | Houma |
| Minimum | 79.0% | 33.8% |
| Maximum | 98.3% | 94.5% |
| Range | 19.3% | 60.8% |
| Mean | 90.0% | 75.5% |
| Median | 90.6% | 81.4% |
| Interquartile 25% (IQ1) | 88.1% | 72.2% |
| Interquartile 75% (IQ3) | 92.4% | 85.4% |
| Interquartile Range (IQR) | 4.3% | 13.2% |
| Standard Deviation (Sample) | 3.5% | 16.1% |
| Standard Deviation (Population) | 3.5% | 15.9% |
Similar Demographics by High School Diploma
Demographics Similar to Immigrants from Iraq by High School Diploma
In terms of high school diploma, the demographic groups most similar to Immigrants from Iraq are Alsatian (89.4%, a difference of 0.030%), Asian (89.4%, a difference of 0.040%), Immigrants from Northern Africa (89.4%, a difference of 0.040%), Paraguayan (89.5%, a difference of 0.050%), and Immigrants from Argentina (89.4%, a difference of 0.050%).
| Demographics | Rating | Rank | High School Diploma |
| Immigrants | Spain | 76.2 /100 | #146 | Good 89.5% |
| Iraqis | 73.9 /100 | #147 | Good 89.5% |
| Immigrants | Lebanon | 73.4 /100 | #148 | Good 89.5% |
| Immigrants | Poland | 72.9 /100 | #149 | Good 89.5% |
| Argentineans | 72.3 /100 | #150 | Good 89.5% |
| Paraguayans | 71.4 /100 | #151 | Good 89.5% |
| Asians | 70.7 /100 | #152 | Good 89.4% |
| Immigrants | Iraq | 68.7 /100 | #153 | Good 89.4% |
| Alsatians | 66.8 /100 | #154 | Good 89.4% |
| Immigrants | Northern Africa | 66.4 /100 | #155 | Good 89.4% |
| Immigrants | Argentina | 65.5 /100 | #156 | Good 89.4% |
| Immigrants | Malaysia | 63.5 /100 | #157 | Good 89.3% |
| Immigrants | Pakistan | 62.5 /100 | #158 | Good 89.3% |
| Immigrants | China | 62.0 /100 | #159 | Good 89.3% |
| Laotians | 61.8 /100 | #160 | Good 89.3% |
Demographics Similar to Houma by High School Diploma
In terms of high school diploma, the demographic groups most similar to Houma are Pima (81.6%, a difference of 0.11%), Mexican (81.4%, a difference of 0.15%), Salvadoran (81.7%, a difference of 0.20%), Immigrants from Guatemala (81.4%, a difference of 0.20%), and Immigrants from Yemen (81.8%, a difference of 0.38%).
| Demographics | Rating | Rank | High School Diploma |
| Immigrants | Latin America | 0.0 /100 | #333 | Tragic 82.1% |
| Tohono O'odham | 0.0 /100 | #334 | Tragic 82.1% |
| Guatemalans | 0.0 /100 | #335 | Tragic 82.0% |
| Immigrants | Dominican Republic | 0.0 /100 | #336 | Tragic 82.0% |
| Immigrants | Yemen | 0.0 /100 | #337 | Tragic 81.8% |
| Salvadorans | 0.0 /100 | #338 | Tragic 81.7% |
| Pima | 0.0 /100 | #339 | Tragic 81.6% |
| Houma | 0.0 /100 | #340 | Tragic 81.5% |
| Mexicans | 0.0 /100 | #341 | Tragic 81.4% |
| Immigrants | Guatemala | 0.0 /100 | #342 | Tragic 81.4% |
| Immigrants | El Salvador | 0.0 /100 | #343 | Tragic 80.8% |
| Immigrants | Central America | 0.0 /100 | #344 | Tragic 80.1% |
| Yakama | 0.0 /100 | #345 | Tragic 80.0% |
| Spanish American Indians | 0.0 /100 | #346 | Tragic 79.8% |
| Immigrants | Mexico | 0.0 /100 | #347 | Tragic 79.5% |