Immigrants from Israel vs Central American Unemployment Among Ages 60 to 64 years
COMPARE
Immigrants from Israel
Central American
Unemployment Among Ages 60 to 64 years
Unemployment Among Ages 60 to 64 years Comparison
Immigrants from Israel
Central Americans
5.3%
UNEMPLOYMENT AMONG AGES 60 TO 64 YEARS
0.0/ 100
METRIC RATING
293rd/ 347
METRIC RANK
5.2%
UNEMPLOYMENT AMONG AGES 60 TO 64 YEARS
0.0/ 100
METRIC RATING
276th/ 347
METRIC RANK
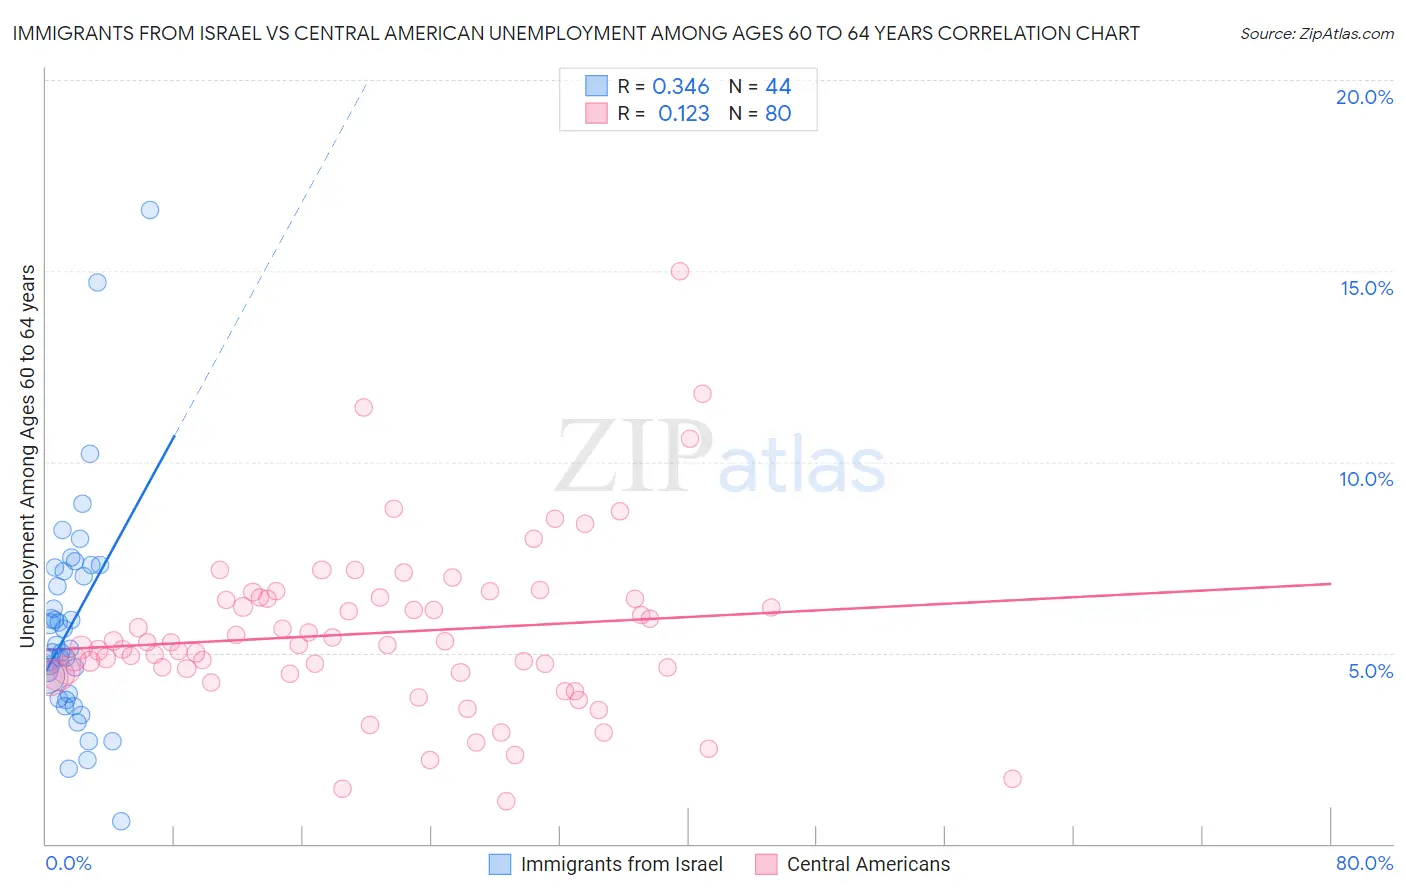
Immigrants from Israel vs Central American Unemployment Among Ages 60 to 64 years Correlation Chart
The statistical analysis conducted on geographies consisting of 200,674,743 people shows a mild positive correlation between the proportion of Immigrants from Israel and unemployment rate among population between the ages 60 and 64 in the United States with a correlation coefficient (R) of 0.346 and weighted average of 5.3%. Similarly, the statistical analysis conducted on geographies consisting of 436,480,787 people shows a poor positive correlation between the proportion of Central Americans and unemployment rate among population between the ages 60 and 64 in the United States with a correlation coefficient (R) of 0.123 and weighted average of 5.2%, a difference of 2.3%.
Unemployment Among Ages 60 to 64 years Correlation Summary
| Measurement | Immigrants from Israel | Central American |
| Minimum | 0.60% | 1.1% |
| Maximum | 16.6% | 15.0% |
| Range | 16.0% | 13.9% |
| Mean | 5.8% | 5.5% |
| Median | 5.2% | 5.2% |
| Interquartile 25% (IQ1) | 3.9% | 4.5% |
| Interquartile 75% (IQ3) | 7.2% | 6.4% |
| Interquartile Range (IQR) | 3.3% | 2.0% |
| Standard Deviation (Sample) | 2.9% | 2.3% |
| Standard Deviation (Population) | 2.9% | 2.2% |
Demographics Similar to Immigrants from Israel and Central Americans by Unemployment Among Ages 60 to 64 years
In terms of unemployment among ages 60 to 64 years, the demographic groups most similar to Immigrants from Israel are Immigrants from Latin America (5.3%, a difference of 0.020%), Hispanic or Latino (5.3%, a difference of 0.040%), Black/African American (5.3%, a difference of 0.11%), Immigrants from Trinidad and Tobago (5.3%, a difference of 0.35%), and Spanish American (5.3%, a difference of 0.39%). Similarly, the demographic groups most similar to Central Americans are Immigrants from Hong Kong (5.2%, a difference of 0.16%), Immigrants from Caribbean (5.2%, a difference of 0.27%), Hopi (5.2%, a difference of 0.30%), Guatemalan (5.2%, a difference of 0.64%), and Nepalese (5.2%, a difference of 0.84%).
| Demographics | Rating | Rank | Unemployment Among Ages 60 to 64 years |
| Hopi | 0.1 /100 | #274 | Tragic 5.2% |
| Immigrants | Hong Kong | 0.1 /100 | #275 | Tragic 5.2% |
| Central Americans | 0.0 /100 | #276 | Tragic 5.2% |
| Immigrants | Caribbean | 0.0 /100 | #277 | Tragic 5.2% |
| Guatemalans | 0.0 /100 | #278 | Tragic 5.2% |
| Nepalese | 0.0 /100 | #279 | Tragic 5.2% |
| French American Indians | 0.0 /100 | #280 | Tragic 5.2% |
| Immigrants | Haiti | 0.0 /100 | #281 | Tragic 5.2% |
| Mexicans | 0.0 /100 | #282 | Tragic 5.2% |
| Immigrants | Guatemala | 0.0 /100 | #283 | Tragic 5.3% |
| Taiwanese | 0.0 /100 | #284 | Tragic 5.3% |
| West Indians | 0.0 /100 | #285 | Tragic 5.3% |
| Mexican American Indians | 0.0 /100 | #286 | Tragic 5.3% |
| Salvadorans | 0.0 /100 | #287 | Tragic 5.3% |
| Trinidadians and Tobagonians | 0.0 /100 | #288 | Tragic 5.3% |
| Spanish Americans | 0.0 /100 | #289 | Tragic 5.3% |
| Immigrants | Trinidad and Tobago | 0.0 /100 | #290 | Tragic 5.3% |
| Hispanics or Latinos | 0.0 /100 | #291 | Tragic 5.3% |
| Immigrants | Latin America | 0.0 /100 | #292 | Tragic 5.3% |
| Immigrants | Israel | 0.0 /100 | #293 | Tragic 5.3% |
| Blacks/African Americans | 0.0 /100 | #294 | Tragic 5.3% |