Immigrants from Iraq vs Lumbee Kindergarten
COMPARE
Immigrants from Iraq
Lumbee
Kindergarten
Kindergarten Comparison
Immigrants from Iraq
Lumbee
97.6%
KINDERGARTEN
0.9/ 100
METRIC RATING
252nd/ 347
METRIC RANK
98.5%
KINDERGARTEN
99.9/ 100
METRIC RATING
43rd/ 347
METRIC RANK
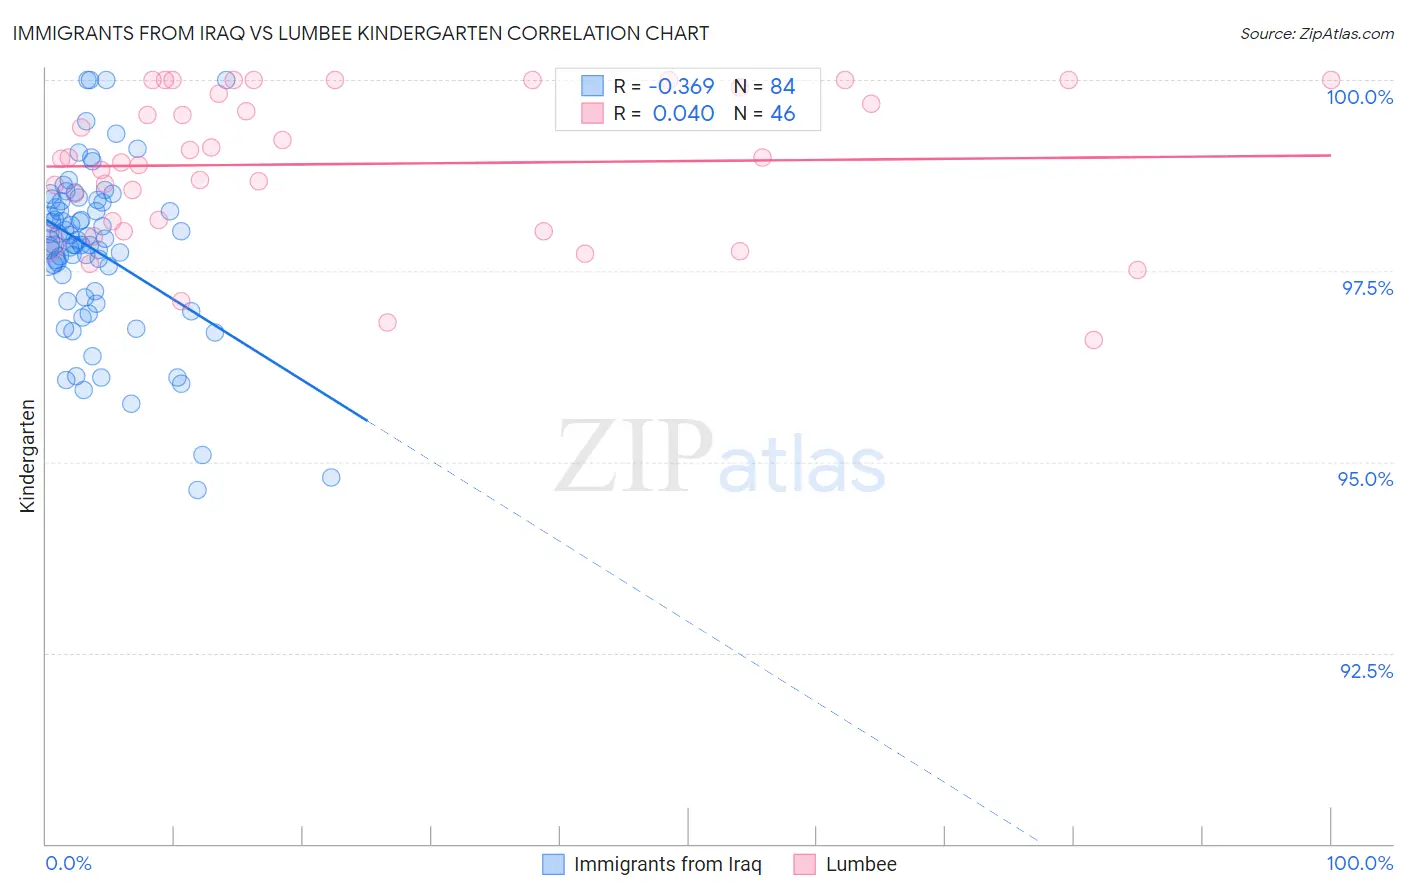
Immigrants from Iraq vs Lumbee Kindergarten Correlation Chart
The statistical analysis conducted on geographies consisting of 194,726,982 people shows a mild negative correlation between the proportion of Immigrants from Iraq and percentage of population with at least kindergarten education in the United States with a correlation coefficient (R) of -0.369 and weighted average of 97.6%. Similarly, the statistical analysis conducted on geographies consisting of 92,298,794 people shows no correlation between the proportion of Lumbee and percentage of population with at least kindergarten education in the United States with a correlation coefficient (R) of 0.040 and weighted average of 98.5%, a difference of 0.90%.
Kindergarten Correlation Summary
| Measurement | Immigrants from Iraq | Lumbee |
| Minimum | 94.6% | 96.6% |
| Maximum | 100.0% | 100.0% |
| Range | 5.4% | 3.4% |
| Mean | 97.8% | 98.9% |
| Median | 97.9% | 99.0% |
| Interquartile 25% (IQ1) | 97.2% | 98.1% |
| Interquartile 75% (IQ3) | 98.4% | 99.9% |
| Interquartile Range (IQR) | 1.2% | 1.8% |
| Standard Deviation (Sample) | 1.1% | 0.96% |
| Standard Deviation (Population) | 1.1% | 0.95% |
Similar Demographics by Kindergarten
Demographics Similar to Immigrants from Iraq by Kindergarten
In terms of kindergarten, the demographic groups most similar to Immigrants from Iraq are Ethiopian (97.6%, a difference of 0.0%), Immigrants from Africa (97.6%, a difference of 0.0%), Indian (Asian) (97.6%, a difference of 0.010%), Immigrants from Eastern Africa (97.6%, a difference of 0.010%), and Immigrants from Middle Africa (97.6%, a difference of 0.010%).
| Demographics | Rating | Rank | Kindergarten |
| South Americans | 1.1 /100 | #245 | Tragic 97.6% |
| Indians (Asian) | 1.0 /100 | #246 | Tragic 97.6% |
| Immigrants | Eastern Africa | 1.0 /100 | #247 | Tragic 97.6% |
| Immigrants | Middle Africa | 1.0 /100 | #248 | Tragic 97.6% |
| Peruvians | 1.0 /100 | #249 | Tragic 97.6% |
| Immigrants | Senegal | 0.9 /100 | #250 | Tragic 97.6% |
| Ethiopians | 0.9 /100 | #251 | Tragic 97.6% |
| Immigrants | Iraq | 0.9 /100 | #252 | Tragic 97.6% |
| Immigrants | Africa | 0.8 /100 | #253 | Tragic 97.6% |
| Immigrants | Asia | 0.8 /100 | #254 | Tragic 97.6% |
| Immigrants | Congo | 0.8 /100 | #255 | Tragic 97.6% |
| Yaqui | 0.7 /100 | #256 | Tragic 97.6% |
| Immigrants | Colombia | 0.6 /100 | #257 | Tragic 97.6% |
| Jamaicans | 0.6 /100 | #258 | Tragic 97.6% |
| Armenians | 0.5 /100 | #259 | Tragic 97.6% |
Demographics Similar to Lumbee by Kindergarten
In terms of kindergarten, the demographic groups most similar to Lumbee are Northern European (98.5%, a difference of 0.0%), Belgian (98.5%, a difference of 0.0%), Luxembourger (98.5%, a difference of 0.010%), Eastern European (98.5%, a difference of 0.010%), and Native Hawaiian (98.5%, a difference of 0.010%).
| Demographics | Rating | Rank | Kindergarten |
| British | 99.9 /100 | #36 | Exceptional 98.5% |
| Italians | 99.9 /100 | #37 | Exceptional 98.5% |
| Latvians | 99.9 /100 | #38 | Exceptional 98.5% |
| Chippewa | 99.9 /100 | #39 | Exceptional 98.5% |
| Luxembourgers | 99.9 /100 | #40 | Exceptional 98.5% |
| Eastern Europeans | 99.9 /100 | #41 | Exceptional 98.5% |
| Native Hawaiians | 99.9 /100 | #42 | Exceptional 98.5% |
| Lumbee | 99.9 /100 | #43 | Exceptional 98.5% |
| Northern Europeans | 99.9 /100 | #44 | Exceptional 98.5% |
| Belgians | 99.9 /100 | #45 | Exceptional 98.5% |
| Hungarians | 99.9 /100 | #46 | Exceptional 98.5% |
| Czechoslovakians | 99.8 /100 | #47 | Exceptional 98.4% |
| Ottawa | 99.8 /100 | #48 | Exceptional 98.4% |
| Kiowa | 99.8 /100 | #49 | Exceptional 98.4% |
| Whites/Caucasians | 99.8 /100 | #50 | Exceptional 98.4% |