Immigrants from Iraq vs Immigrants from Laos Householder Income Ages 25 - 44 years
COMPARE
Immigrants from Iraq
Immigrants from Laos
Householder Income Ages 25 - 44 years
Householder Income Ages 25 - 44 years Comparison
Immigrants from Iraq
Immigrants from Laos
$89,444
HOUSEHOLDER INCOME AGES 25 - 44 YEARS
5.5/ 100
METRIC RATING
226th/ 347
METRIC RANK
$85,553
HOUSEHOLDER INCOME AGES 25 - 44 YEARS
0.7/ 100
METRIC RATING
254th/ 347
METRIC RANK
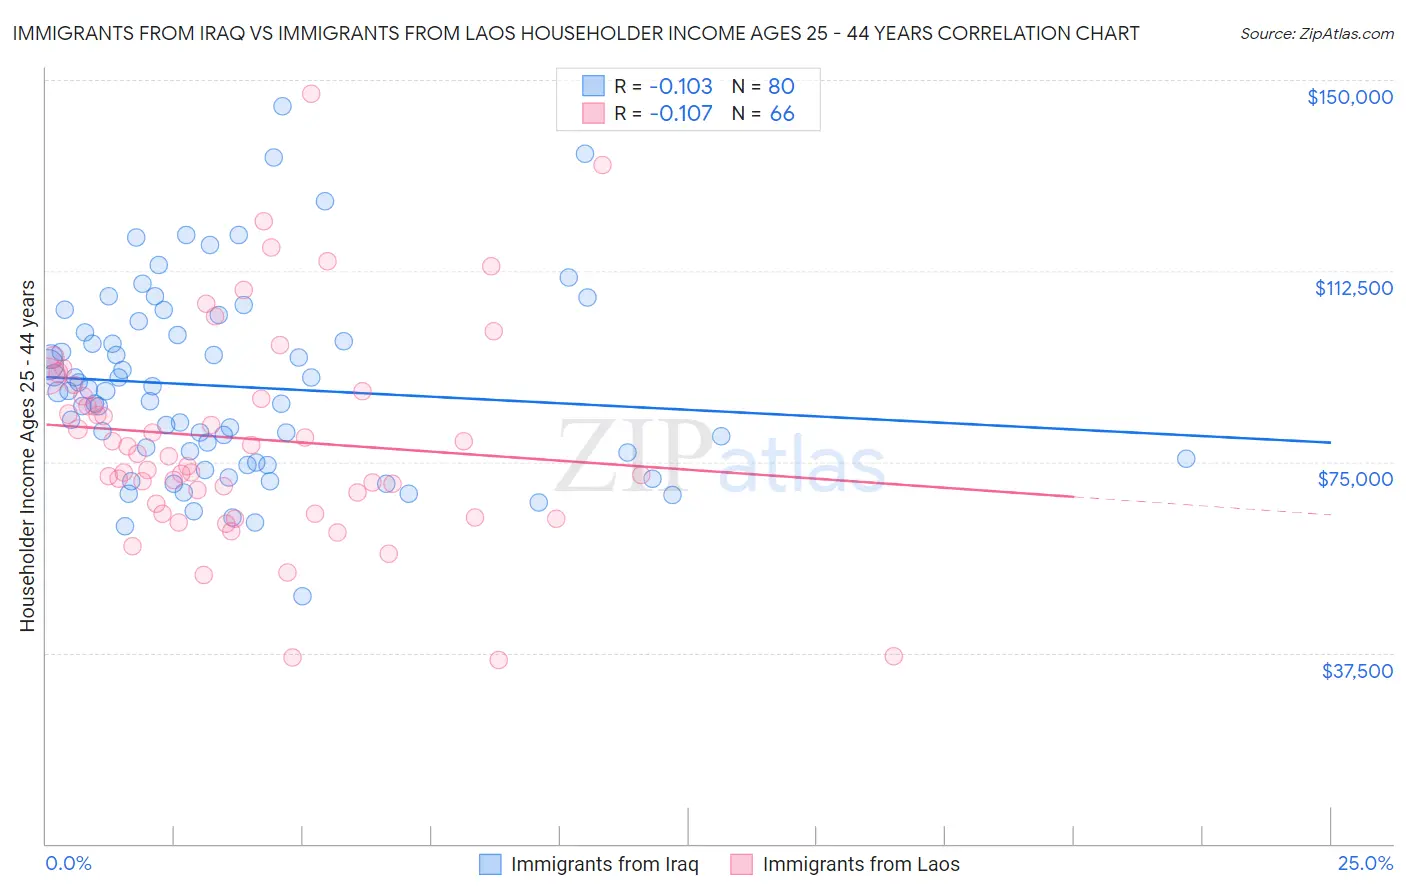
Immigrants from Iraq vs Immigrants from Laos Householder Income Ages 25 - 44 years Correlation Chart
The statistical analysis conducted on geographies consisting of 194,665,835 people shows a poor negative correlation between the proportion of Immigrants from Iraq and household income with householder between the ages 25 and 44 in the United States with a correlation coefficient (R) of -0.103 and weighted average of $89,444. Similarly, the statistical analysis conducted on geographies consisting of 201,332,387 people shows a poor negative correlation between the proportion of Immigrants from Laos and household income with householder between the ages 25 and 44 in the United States with a correlation coefficient (R) of -0.107 and weighted average of $85,553, a difference of 4.5%.
Householder Income Ages 25 - 44 years Correlation Summary
| Measurement | Immigrants from Iraq | Immigrants from Laos |
| Minimum | $48,509 | $36,106 |
| Maximum | $144,841 | $147,348 |
| Range | $96,332 | $111,242 |
| Mean | $89,769 | $79,556 |
| Median | $88,796 | $76,403 |
| Interquartile 25% (IQ1) | $75,233 | $66,885 |
| Interquartile 75% (IQ3) | $100,185 | $88,750 |
| Interquartile Range (IQR) | $24,952 | $21,865 |
| Standard Deviation (Sample) | $18,567 | $21,017 |
| Standard Deviation (Population) | $18,451 | $20,857 |
Similar Demographics by Householder Income Ages 25 - 44 years
Demographics Similar to Immigrants from Iraq by Householder Income Ages 25 - 44 years
In terms of householder income ages 25 - 44 years, the demographic groups most similar to Immigrants from Iraq are Immigrants from Panama ($89,451, a difference of 0.010%), Barbadian ($89,565, a difference of 0.14%), Immigrants from Guyana ($89,586, a difference of 0.16%), Immigrants from Ecuador ($89,673, a difference of 0.26%), and Immigrants from Trinidad and Tobago ($89,748, a difference of 0.34%).
| Demographics | Rating | Rank | Householder Income Ages 25 - 44 years |
| Delaware | 6.9 /100 | #219 | Tragic $89,876 |
| Trinidadians and Tobagonians | 6.8 /100 | #220 | Tragic $89,856 |
| Immigrants | Trinidad and Tobago | 6.5 /100 | #221 | Tragic $89,748 |
| Immigrants | Ecuador | 6.2 /100 | #222 | Tragic $89,673 |
| Immigrants | Guyana | 5.9 /100 | #223 | Tragic $89,586 |
| Barbadians | 5.9 /100 | #224 | Tragic $89,565 |
| Immigrants | Panama | 5.5 /100 | #225 | Tragic $89,451 |
| Immigrants | Iraq | 5.5 /100 | #226 | Tragic $89,444 |
| Immigrants | St. Vincent and the Grenadines | 4.1 /100 | #227 | Tragic $88,888 |
| Immigrants | Bosnia and Herzegovina | 4.0 /100 | #228 | Tragic $88,819 |
| Immigrants | Barbados | 3.7 /100 | #229 | Tragic $88,687 |
| Alaskan Athabascans | 3.3 /100 | #230 | Tragic $88,446 |
| Immigrants | Grenada | 3.0 /100 | #231 | Tragic $88,311 |
| Immigrants | Nonimmigrants | 3.0 /100 | #232 | Tragic $88,301 |
| Malaysians | 3.0 /100 | #233 | Tragic $88,291 |
Demographics Similar to Immigrants from Laos by Householder Income Ages 25 - 44 years
In terms of householder income ages 25 - 44 years, the demographic groups most similar to Immigrants from Laos are British West Indian ($85,565, a difference of 0.010%), Immigrants from Western Africa ($85,676, a difference of 0.14%), Cape Verdean ($85,758, a difference of 0.24%), Pennsylvania German ($85,836, a difference of 0.33%), and German Russian ($85,220, a difference of 0.39%).
| Demographics | Rating | Rank | Householder Income Ages 25 - 44 years |
| Immigrants | Nigeria | 1.2 /100 | #247 | Tragic $86,589 |
| Immigrants | Sudan | 0.9 /100 | #248 | Tragic $86,109 |
| French American Indians | 0.8 /100 | #249 | Tragic $85,899 |
| Pennsylvania Germans | 0.8 /100 | #250 | Tragic $85,836 |
| Cape Verdeans | 0.8 /100 | #251 | Tragic $85,758 |
| Immigrants | Western Africa | 0.7 /100 | #252 | Tragic $85,676 |
| British West Indians | 0.7 /100 | #253 | Tragic $85,565 |
| Immigrants | Laos | 0.7 /100 | #254 | Tragic $85,553 |
| German Russians | 0.6 /100 | #255 | Tragic $85,220 |
| Central Americans | 0.5 /100 | #256 | Tragic $85,144 |
| Mexican American Indians | 0.5 /100 | #257 | Tragic $85,066 |
| Immigrants | Nicaragua | 0.5 /100 | #258 | Tragic $84,914 |
| Immigrants | Senegal | 0.5 /100 | #259 | Tragic $84,848 |
| Americans | 0.4 /100 | #260 | Tragic $84,791 |
| Inupiat | 0.4 /100 | #261 | Tragic $84,619 |