Immigrants from Indonesia vs Subsaharan African Median Female Earnings
COMPARE
Immigrants from Indonesia
Subsaharan African
Median Female Earnings
Median Female Earnings Comparison
Immigrants from Indonesia
Sub-Saharan Africans
$43,412
MEDIAN FEMALE EARNINGS
100.0/ 100
METRIC RATING
48th/ 347
METRIC RANK
$38,391
MEDIAN FEMALE EARNINGS
6.2/ 100
METRIC RATING
228th/ 347
METRIC RANK
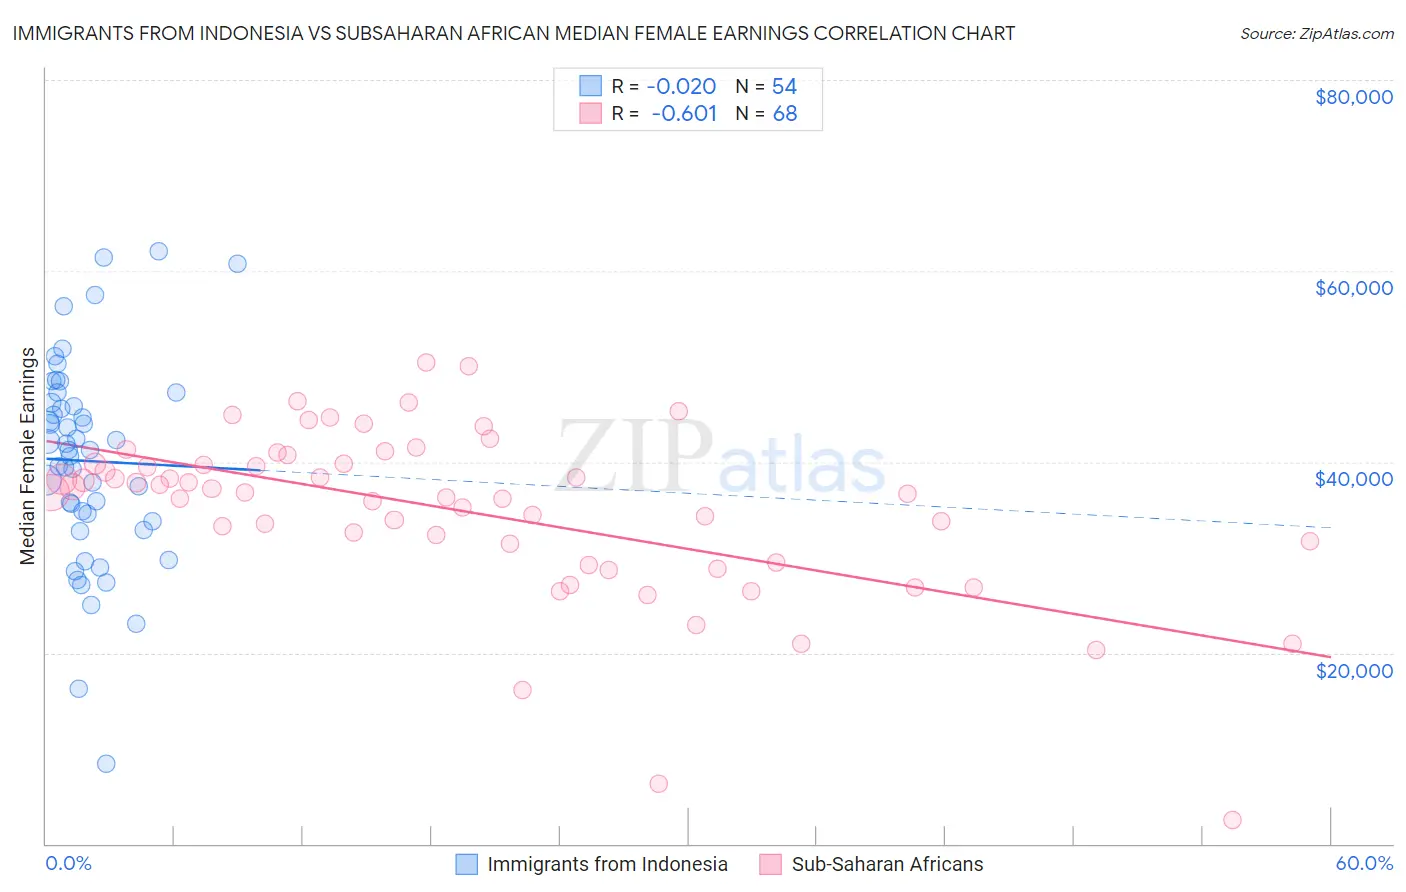
Immigrants from Indonesia vs Subsaharan African Median Female Earnings Correlation Chart
The statistical analysis conducted on geographies consisting of 215,754,485 people shows no correlation between the proportion of Immigrants from Indonesia and median female earnings in the United States with a correlation coefficient (R) of -0.020 and weighted average of $43,412. Similarly, the statistical analysis conducted on geographies consisting of 507,707,888 people shows a significant negative correlation between the proportion of Sub-Saharan Africans and median female earnings in the United States with a correlation coefficient (R) of -0.601 and weighted average of $38,391, a difference of 13.1%.
Median Female Earnings Correlation Summary
| Measurement | Immigrants from Indonesia | Subsaharan African |
| Minimum | $8,380 | $2,499 |
| Maximum | $62,036 | $50,416 |
| Range | $53,656 | $47,917 |
| Mean | $40,096 | $34,847 |
| Median | $41,238 | $36,829 |
| Interquartile 25% (IQ1) | $33,750 | $30,475 |
| Interquartile 75% (IQ3) | $46,213 | $39,811 |
| Interquartile Range (IQR) | $12,463 | $9,336 |
| Standard Deviation (Sample) | $10,783 | $8,928 |
| Standard Deviation (Population) | $10,682 | $8,863 |
Similar Demographics by Median Female Earnings
Demographics Similar to Immigrants from Indonesia by Median Female Earnings
In terms of median female earnings, the demographic groups most similar to Immigrants from Indonesia are Immigrants from Serbia ($43,385, a difference of 0.060%), Bolivian ($43,445, a difference of 0.070%), Immigrants from Uzbekistan ($43,363, a difference of 0.11%), Immigrants from Bolivia ($43,467, a difference of 0.13%), and Maltese ($43,357, a difference of 0.13%).
| Demographics | Rating | Rank | Median Female Earnings |
| Bhutanese | 100.0 /100 | #41 | Exceptional $43,648 |
| Immigrants | Denmark | 100.0 /100 | #42 | Exceptional $43,646 |
| Bulgarians | 100.0 /100 | #43 | Exceptional $43,638 |
| Immigrants | Czechoslovakia | 100.0 /100 | #44 | Exceptional $43,571 |
| Immigrants | Europe | 100.0 /100 | #45 | Exceptional $43,523 |
| Immigrants | Bolivia | 100.0 /100 | #46 | Exceptional $43,467 |
| Bolivians | 100.0 /100 | #47 | Exceptional $43,445 |
| Immigrants | Indonesia | 100.0 /100 | #48 | Exceptional $43,412 |
| Immigrants | Serbia | 100.0 /100 | #49 | Exceptional $43,385 |
| Immigrants | Uzbekistan | 100.0 /100 | #50 | Exceptional $43,363 |
| Maltese | 100.0 /100 | #51 | Exceptional $43,357 |
| Immigrants | Lithuania | 99.9 /100 | #52 | Exceptional $43,317 |
| Immigrants | Eastern Europe | 99.9 /100 | #53 | Exceptional $43,309 |
| Australians | 99.9 /100 | #54 | Exceptional $43,308 |
| Egyptians | 99.9 /100 | #55 | Exceptional $43,305 |
Demographics Similar to Sub-Saharan Africans by Median Female Earnings
In terms of median female earnings, the demographic groups most similar to Sub-Saharan Africans are Scottish ($38,397, a difference of 0.020%), Belgian ($38,382, a difference of 0.020%), Basque ($38,352, a difference of 0.10%), French Canadian ($38,436, a difference of 0.12%), and Somali ($38,333, a difference of 0.15%).
| Demographics | Rating | Rank | Median Female Earnings |
| Immigrants | Azores | 8.8 /100 | #221 | Tragic $38,573 |
| Japanese | 8.1 /100 | #222 | Tragic $38,528 |
| Immigrants | Sudan | 7.8 /100 | #223 | Tragic $38,511 |
| Native Hawaiians | 7.1 /100 | #224 | Tragic $38,461 |
| French | 7.0 /100 | #225 | Tragic $38,457 |
| French Canadians | 6.8 /100 | #226 | Tragic $38,436 |
| Scottish | 6.3 /100 | #227 | Tragic $38,397 |
| Sub-Saharan Africans | 6.2 /100 | #228 | Tragic $38,391 |
| Belgians | 6.1 /100 | #229 | Tragic $38,382 |
| Basques | 5.7 /100 | #230 | Tragic $38,352 |
| Somalis | 5.5 /100 | #231 | Tragic $38,333 |
| Scandinavians | 5.2 /100 | #232 | Tragic $38,306 |
| Tongans | 5.1 /100 | #233 | Tragic $38,288 |
| Celtics | 5.0 /100 | #234 | Tragic $38,283 |
| Sudanese | 4.4 /100 | #235 | Tragic $38,215 |