Immigrants from Indonesia vs South American No Schooling Completed
COMPARE
Immigrants from Indonesia
South American
No Schooling Completed
No Schooling Completed Comparison
Immigrants from Indonesia
South Americans
2.4%
NO SCHOOLING COMPLETED
1.5/ 100
METRIC RATING
242nd/ 347
METRIC RANK
2.4%
NO SCHOOLING COMPLETED
1.5/ 100
METRIC RATING
243rd/ 347
METRIC RANK
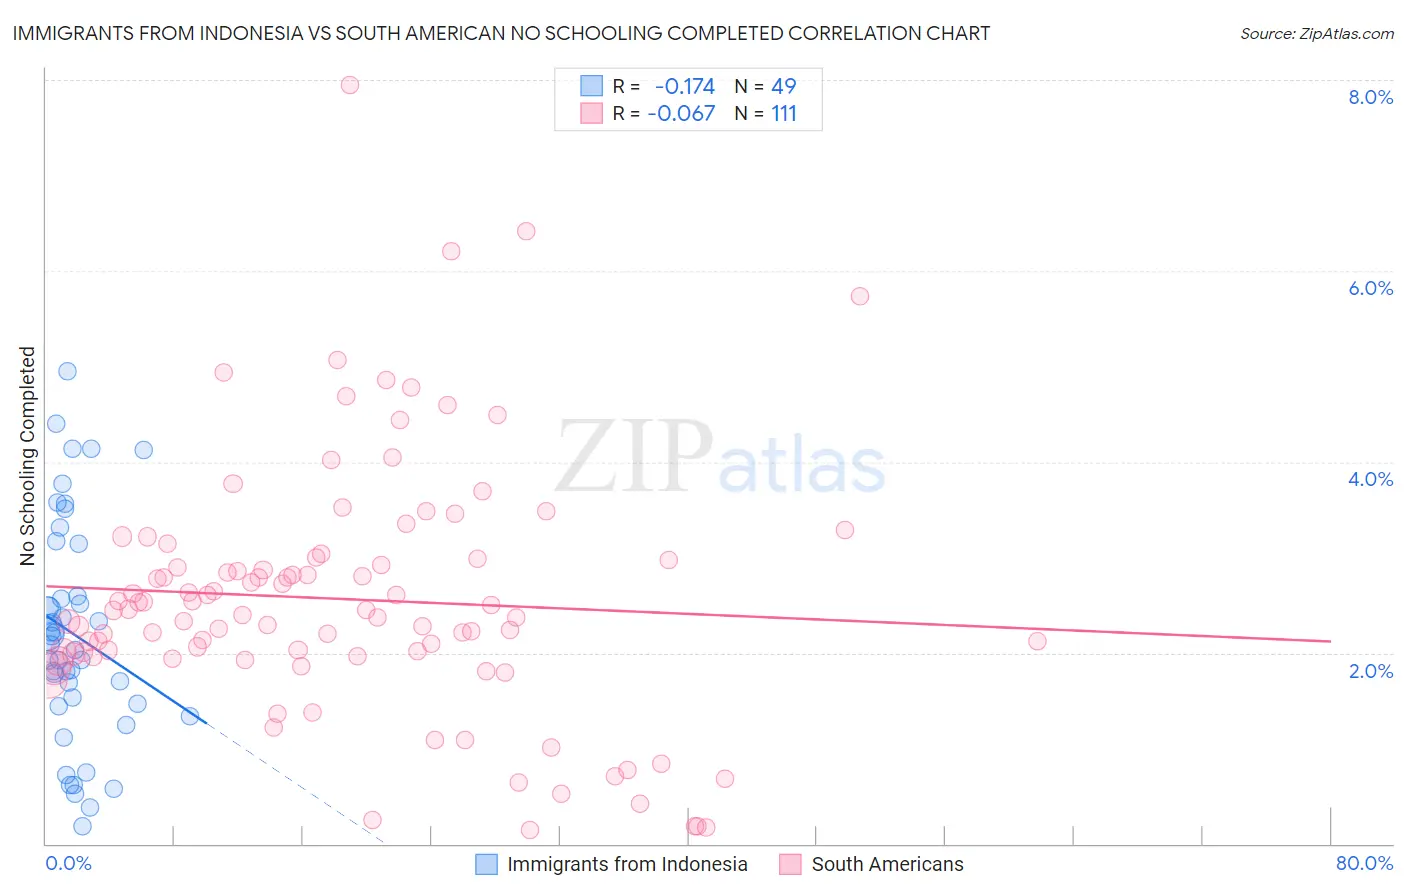
Immigrants from Indonesia vs South American No Schooling Completed Correlation Chart
The statistical analysis conducted on geographies consisting of 214,703,374 people shows a poor negative correlation between the proportion of Immigrants from Indonesia and percentage of population with no schooling in the United States with a correlation coefficient (R) of -0.174 and weighted average of 2.4%. Similarly, the statistical analysis conducted on geographies consisting of 486,388,678 people shows a slight negative correlation between the proportion of South Americans and percentage of population with no schooling in the United States with a correlation coefficient (R) of -0.067 and weighted average of 2.4%, a difference of 0.040%.
No Schooling Completed Correlation Summary
| Measurement | Immigrants from Indonesia | South American |
| Minimum | 0.18% | 0.14% |
| Maximum | 4.9% | 7.9% |
| Range | 4.8% | 7.8% |
| Mean | 2.2% | 2.6% |
| Median | 2.1% | 2.4% |
| Interquartile 25% (IQ1) | 1.5% | 2.0% |
| Interquartile 75% (IQ3) | 2.9% | 3.0% |
| Interquartile Range (IQR) | 1.4% | 1.0% |
| Standard Deviation (Sample) | 1.1% | 1.3% |
| Standard Deviation (Population) | 1.1% | 1.3% |
Demographics Similar to Immigrants from Indonesia and South Americans by No Schooling Completed
In terms of no schooling completed, the demographic groups most similar to Immigrants from Indonesia are Peruvian (2.4%, a difference of 0.14%), Bolivian (2.4%, a difference of 0.15%), Immigrants from Congo (2.4%, a difference of 0.20%), Immigrants from Iraq (2.4%, a difference of 0.30%), and Korean (2.4%, a difference of 0.32%). Similarly, the demographic groups most similar to South Americans are Peruvian (2.4%, a difference of 0.11%), Bolivian (2.4%, a difference of 0.11%), Immigrants from Congo (2.4%, a difference of 0.16%), Immigrants from Iraq (2.4%, a difference of 0.27%), and Korean (2.4%, a difference of 0.36%).
| Demographics | Rating | Rank | No Schooling Completed |
| Colombians | 3.2 /100 | #232 | Tragic 2.3% |
| Immigrants | Malaysia | 2.8 /100 | #233 | Tragic 2.3% |
| Nigerians | 2.6 /100 | #234 | Tragic 2.3% |
| Immigrants | Western Asia | 2.6 /100 | #235 | Tragic 2.3% |
| Iraqis | 2.2 /100 | #236 | Tragic 2.4% |
| Immigrants | Eastern Asia | 2.0 /100 | #237 | Tragic 2.4% |
| Paiute | 1.9 /100 | #238 | Tragic 2.4% |
| Liberians | 1.8 /100 | #239 | Tragic 2.4% |
| Immigrants | Senegal | 1.7 /100 | #240 | Tragic 2.4% |
| Koreans | 1.7 /100 | #241 | Tragic 2.4% |
| Immigrants | Indonesia | 1.5 /100 | #242 | Tragic 2.4% |
| South Americans | 1.5 /100 | #243 | Tragic 2.4% |
| Peruvians | 1.4 /100 | #244 | Tragic 2.4% |
| Bolivians | 1.4 /100 | #245 | Tragic 2.4% |
| Immigrants | Congo | 1.4 /100 | #246 | Tragic 2.4% |
| Immigrants | Iraq | 1.3 /100 | #247 | Tragic 2.4% |
| Asians | 1.2 /100 | #248 | Tragic 2.4% |
| Jamaicans | 1.2 /100 | #249 | Tragic 2.4% |
| Immigrants | Middle Africa | 1.1 /100 | #250 | Tragic 2.4% |
| Immigrants | Africa | 1.1 /100 | #251 | Tragic 2.4% |
| Immigrants | Colombia | 1.0 /100 | #252 | Tragic 2.4% |