Immigrants from Indonesia vs Tongan Nursery School
COMPARE
Immigrants from Indonesia
Tongan
Nursery School
Nursery School Comparison
Immigrants from Indonesia
Tongans
97.7%
NURSERY SCHOOL
1.1/ 100
METRIC RATING
241st/ 347
METRIC RANK
97.8%
NURSERY SCHOOL
4.3/ 100
METRIC RATING
221st/ 347
METRIC RANK
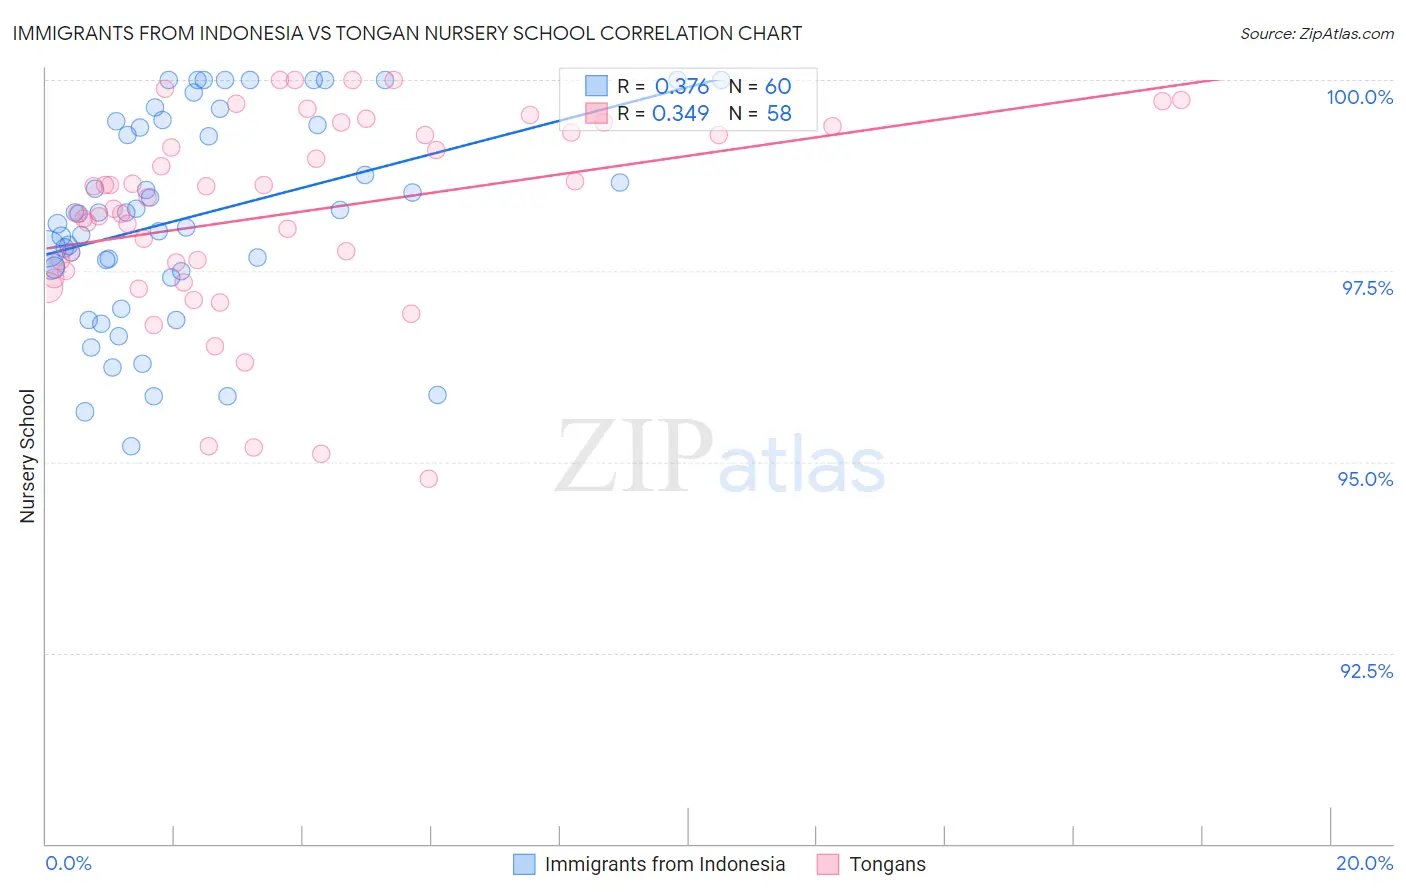
Immigrants from Indonesia vs Tongan Nursery School Correlation Chart
The statistical analysis conducted on geographies consisting of 215,783,142 people shows a mild positive correlation between the proportion of Immigrants from Indonesia and percentage of population with at least nursery school education in the United States with a correlation coefficient (R) of 0.376 and weighted average of 97.7%. Similarly, the statistical analysis conducted on geographies consisting of 102,908,759 people shows a mild positive correlation between the proportion of Tongans and percentage of population with at least nursery school education in the United States with a correlation coefficient (R) of 0.349 and weighted average of 97.8%, a difference of 0.10%.
Nursery School Correlation Summary
| Measurement | Immigrants from Indonesia | Tongan |
| Minimum | 95.2% | 94.8% |
| Maximum | 100.0% | 100.0% |
| Range | 4.8% | 5.2% |
| Mean | 98.2% | 98.2% |
| Median | 98.3% | 98.4% |
| Interquartile 25% (IQ1) | 97.5% | 97.5% |
| Interquartile 75% (IQ3) | 99.4% | 99.3% |
| Interquartile Range (IQR) | 1.9% | 1.8% |
| Standard Deviation (Sample) | 1.3% | 1.3% |
| Standard Deviation (Population) | 1.3% | 1.3% |
Demographics Similar to Immigrants from Indonesia and Tongans by Nursery School
In terms of nursery school, the demographic groups most similar to Immigrants from Indonesia are Immigrants from Eastern Asia (97.7%, a difference of 0.020%), Korean (97.7%, a difference of 0.020%), Nigerian (97.7%, a difference of 0.030%), Immigrants from Malaysia (97.7%, a difference of 0.040%), and Immigrants from Western Asia (97.7%, a difference of 0.040%). Similarly, the demographic groups most similar to Tongans are Immigrants from Syria (97.7%, a difference of 0.010%), Immigrants from Sudan (97.7%, a difference of 0.010%), Immigrants from Nepal (97.7%, a difference of 0.010%), Immigrants from Costa Rica (97.7%, a difference of 0.020%), and Iraqi (97.7%, a difference of 0.020%).
| Demographics | Rating | Rank | Nursery School |
| Tongans | 4.3 /100 | #221 | Tragic 97.8% |
| Immigrants | Syria | 4.0 /100 | #222 | Tragic 97.7% |
| Immigrants | Sudan | 3.9 /100 | #223 | Tragic 97.7% |
| Immigrants | Nepal | 3.6 /100 | #224 | Tragic 97.7% |
| Immigrants | Costa Rica | 3.5 /100 | #225 | Tragic 97.7% |
| Iraqis | 3.5 /100 | #226 | Tragic 97.7% |
| Sub-Saharan Africans | 3.2 /100 | #227 | Tragic 97.7% |
| Sudanese | 3.2 /100 | #228 | Tragic 97.7% |
| Senegalese | 3.2 /100 | #229 | Tragic 97.7% |
| Sierra Leoneans | 2.9 /100 | #230 | Tragic 97.7% |
| Puerto Ricans | 2.6 /100 | #231 | Tragic 97.7% |
| Immigrants | Uruguay | 2.3 /100 | #232 | Tragic 97.7% |
| U.S. Virgin Islanders | 2.1 /100 | #233 | Tragic 97.7% |
| Colombians | 2.1 /100 | #234 | Tragic 97.7% |
| Immigrants | Pakistan | 2.1 /100 | #235 | Tragic 97.7% |
| Immigrants | Malaysia | 1.9 /100 | #236 | Tragic 97.7% |
| Immigrants | Western Asia | 1.9 /100 | #237 | Tragic 97.7% |
| Nigerians | 1.7 /100 | #238 | Tragic 97.7% |
| Immigrants | Eastern Asia | 1.6 /100 | #239 | Tragic 97.7% |
| Koreans | 1.4 /100 | #240 | Tragic 97.7% |
| Immigrants | Indonesia | 1.1 /100 | #241 | Tragic 97.7% |