Immigrants from Indonesia vs Immigrants from Eastern Africa 7th Grade
COMPARE
Immigrants from Indonesia
Immigrants from Eastern Africa
7th Grade
7th Grade Comparison
Immigrants from Indonesia
Immigrants from Eastern Africa
95.5%
7TH GRADE
3.3/ 100
METRIC RATING
233rd/ 347
METRIC RANK
95.6%
7TH GRADE
5.1/ 100
METRIC RATING
228th/ 347
METRIC RANK
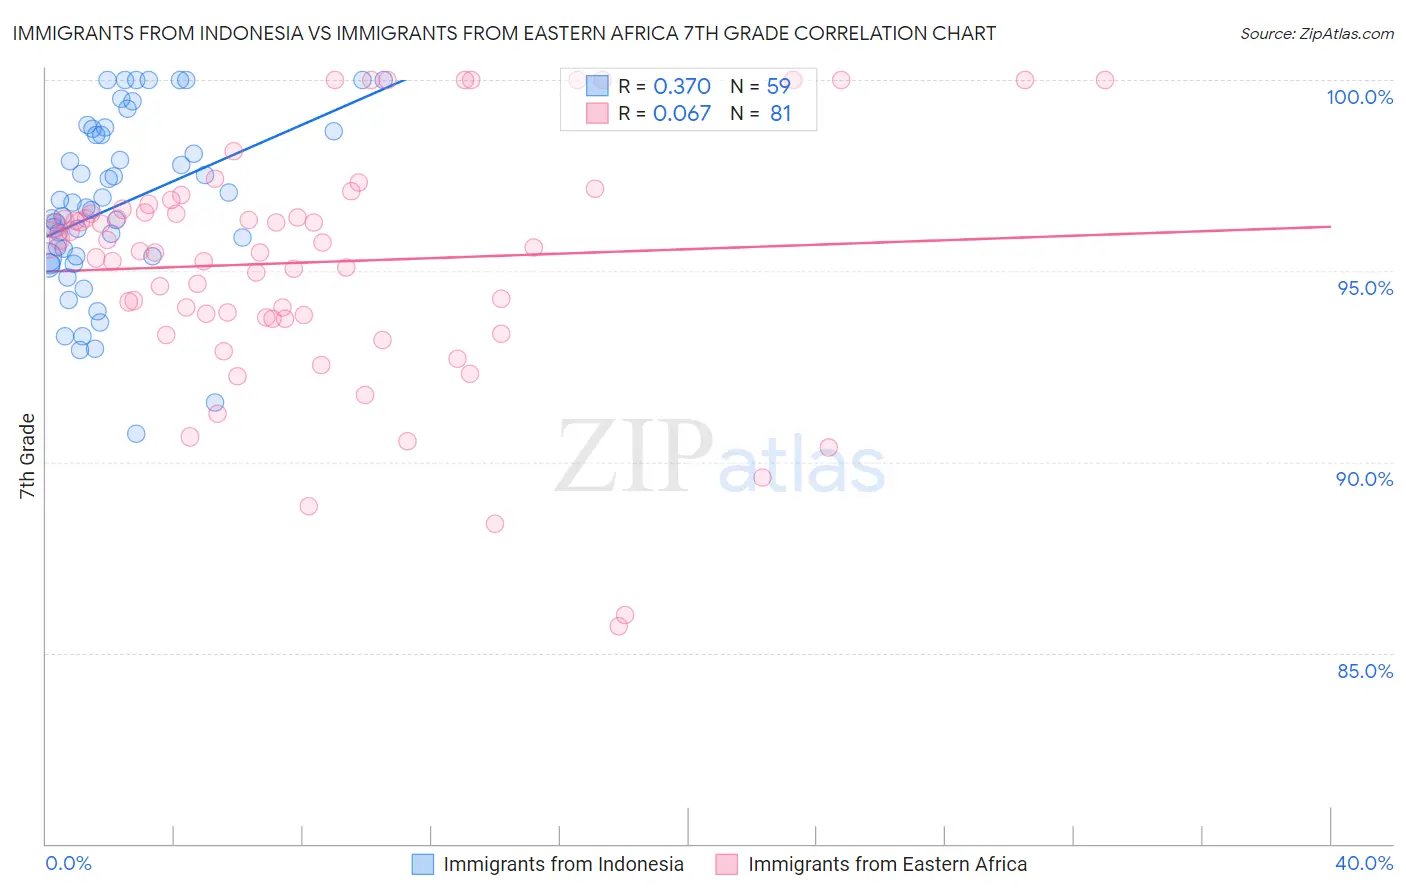
Immigrants from Indonesia vs Immigrants from Eastern Africa 7th Grade Correlation Chart
The statistical analysis conducted on geographies consisting of 215,671,959 people shows a mild positive correlation between the proportion of Immigrants from Indonesia and percentage of population with at least 7th grade education in the United States with a correlation coefficient (R) of 0.370 and weighted average of 95.5%. Similarly, the statistical analysis conducted on geographies consisting of 355,144,184 people shows a slight positive correlation between the proportion of Immigrants from Eastern Africa and percentage of population with at least 7th grade education in the United States with a correlation coefficient (R) of 0.067 and weighted average of 95.6%, a difference of 0.070%.
7th Grade Correlation Summary
| Measurement | Immigrants from Indonesia | Immigrants from Eastern Africa |
| Minimum | 90.7% | 85.7% |
| Maximum | 100.0% | 100.0% |
| Range | 9.3% | 14.3% |
| Mean | 96.7% | 95.2% |
| Median | 96.7% | 95.6% |
| Interquartile 25% (IQ1) | 95.4% | 93.8% |
| Interquartile 75% (IQ3) | 98.7% | 96.7% |
| Interquartile Range (IQR) | 3.3% | 2.9% |
| Standard Deviation (Sample) | 2.3% | 3.1% |
| Standard Deviation (Population) | 2.3% | 3.1% |
Demographics Similar to Immigrants from Indonesia and Immigrants from Eastern Africa by 7th Grade
In terms of 7th grade, the demographic groups most similar to Immigrants from Indonesia are Costa Rican (95.5%, a difference of 0.0%), Nigerian (95.5%, a difference of 0.020%), Senegalese (95.6%, a difference of 0.030%), Immigrants from Africa (95.5%, a difference of 0.030%), and Native/Alaskan (95.6%, a difference of 0.040%). Similarly, the demographic groups most similar to Immigrants from Eastern Africa are Immigrants from Western Asia (95.6%, a difference of 0.010%), Immigrants from Panama (95.6%, a difference of 0.010%), Immigrants from Eastern Asia (95.6%, a difference of 0.020%), Immigrants from Malaysia (95.6%, a difference of 0.030%), and Native/Alaskan (95.6%, a difference of 0.030%).
| Demographics | Rating | Rank | 7th Grade |
| Sub-Saharan Africans | 7.2 /100 | #220 | Tragic 95.7% |
| Samoans | 7.0 /100 | #221 | Tragic 95.7% |
| Laotians | 6.8 /100 | #222 | Tragic 95.7% |
| Immigrants | Syria | 6.7 /100 | #223 | Tragic 95.7% |
| Immigrants | Oceania | 6.7 /100 | #224 | Tragic 95.7% |
| Immigrants | Malaysia | 6.2 /100 | #225 | Tragic 95.6% |
| Immigrants | Eastern Asia | 5.8 /100 | #226 | Tragic 95.6% |
| Immigrants | Western Asia | 5.4 /100 | #227 | Tragic 95.6% |
| Immigrants | Eastern Africa | 5.1 /100 | #228 | Tragic 95.6% |
| Immigrants | Panama | 4.9 /100 | #229 | Tragic 95.6% |
| Natives/Alaskans | 4.2 /100 | #230 | Tragic 95.6% |
| Senegalese | 4.0 /100 | #231 | Tragic 95.6% |
| Costa Ricans | 3.3 /100 | #232 | Tragic 95.5% |
| Immigrants | Indonesia | 3.3 /100 | #233 | Tragic 95.5% |
| Nigerians | 3.0 /100 | #234 | Tragic 95.5% |
| Immigrants | Africa | 2.7 /100 | #235 | Tragic 95.5% |
| Asians | 2.6 /100 | #236 | Tragic 95.5% |
| Immigrants | Asia | 2.3 /100 | #237 | Tragic 95.5% |
| Indians (Asian) | 2.3 /100 | #238 | Tragic 95.5% |
| Jamaicans | 2.2 /100 | #239 | Tragic 95.5% |
| Immigrants | Sierra Leone | 2.0 /100 | #240 | Tragic 95.5% |