Immigrants from Indonesia vs Scandinavian 7th Grade
COMPARE
Immigrants from Indonesia
Scandinavian
7th Grade
7th Grade Comparison
Immigrants from Indonesia
Scandinavians
95.5%
7TH GRADE
3.3/ 100
METRIC RATING
233rd/ 347
METRIC RANK
97.4%
7TH GRADE
100.0/ 100
METRIC RATING
29th/ 347
METRIC RANK
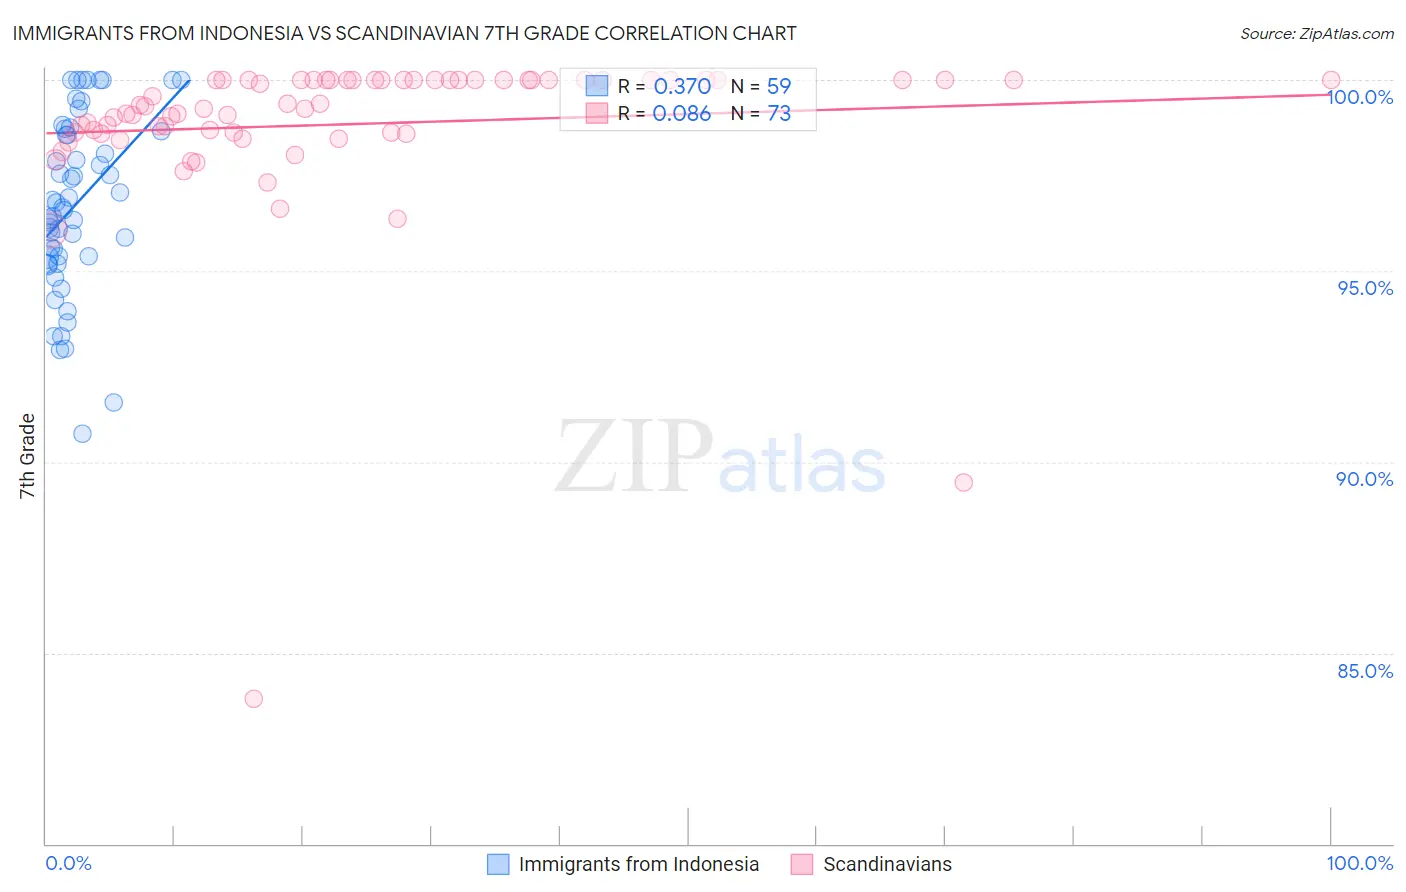
Immigrants from Indonesia vs Scandinavian 7th Grade Correlation Chart
The statistical analysis conducted on geographies consisting of 215,671,959 people shows a mild positive correlation between the proportion of Immigrants from Indonesia and percentage of population with at least 7th grade education in the United States with a correlation coefficient (R) of 0.370 and weighted average of 95.5%. Similarly, the statistical analysis conducted on geographies consisting of 472,660,435 people shows a slight positive correlation between the proportion of Scandinavians and percentage of population with at least 7th grade education in the United States with a correlation coefficient (R) of 0.086 and weighted average of 97.4%, a difference of 1.9%.
7th Grade Correlation Summary
| Measurement | Immigrants from Indonesia | Scandinavian |
| Minimum | 90.7% | 83.8% |
| Maximum | 100.0% | 100.0% |
| Range | 9.3% | 16.2% |
| Mean | 96.7% | 98.8% |
| Median | 96.7% | 99.3% |
| Interquartile 25% (IQ1) | 95.4% | 98.6% |
| Interquartile 75% (IQ3) | 98.7% | 100.0% |
| Interquartile Range (IQR) | 3.3% | 1.4% |
| Standard Deviation (Sample) | 2.3% | 2.3% |
| Standard Deviation (Population) | 2.3% | 2.3% |
Similar Demographics by 7th Grade
Demographics Similar to Immigrants from Indonesia by 7th Grade
In terms of 7th grade, the demographic groups most similar to Immigrants from Indonesia are Costa Rican (95.5%, a difference of 0.0%), Nigerian (95.5%, a difference of 0.020%), Senegalese (95.6%, a difference of 0.030%), Immigrants from Africa (95.5%, a difference of 0.030%), and Native/Alaskan (95.6%, a difference of 0.040%).
| Demographics | Rating | Rank | 7th Grade |
| Immigrants | Eastern Asia | 5.8 /100 | #226 | Tragic 95.6% |
| Immigrants | Western Asia | 5.4 /100 | #227 | Tragic 95.6% |
| Immigrants | Eastern Africa | 5.1 /100 | #228 | Tragic 95.6% |
| Immigrants | Panama | 4.9 /100 | #229 | Tragic 95.6% |
| Natives/Alaskans | 4.2 /100 | #230 | Tragic 95.6% |
| Senegalese | 4.0 /100 | #231 | Tragic 95.6% |
| Costa Ricans | 3.3 /100 | #232 | Tragic 95.5% |
| Immigrants | Indonesia | 3.3 /100 | #233 | Tragic 95.5% |
| Nigerians | 3.0 /100 | #234 | Tragic 95.5% |
| Immigrants | Africa | 2.7 /100 | #235 | Tragic 95.5% |
| Asians | 2.6 /100 | #236 | Tragic 95.5% |
| Immigrants | Asia | 2.3 /100 | #237 | Tragic 95.5% |
| Indians (Asian) | 2.3 /100 | #238 | Tragic 95.5% |
| Jamaicans | 2.2 /100 | #239 | Tragic 95.5% |
| Immigrants | Sierra Leone | 2.0 /100 | #240 | Tragic 95.5% |
Demographics Similar to Scandinavians by 7th Grade
In terms of 7th grade, the demographic groups most similar to Scandinavians are Sioux (97.4%, a difference of 0.0%), Czech (97.4%, a difference of 0.010%), French (97.4%, a difference of 0.030%), Scotch-Irish (97.4%, a difference of 0.030%), and Danish (97.4%, a difference of 0.030%).
| Demographics | Rating | Rank | 7th Grade |
| French Canadians | 100.0 /100 | #22 | Exceptional 97.4% |
| Croatians | 100.0 /100 | #23 | Exceptional 97.4% |
| Welsh | 100.0 /100 | #24 | Exceptional 97.4% |
| French | 100.0 /100 | #25 | Exceptional 97.4% |
| Scotch-Irish | 100.0 /100 | #26 | Exceptional 97.4% |
| Danes | 100.0 /100 | #27 | Exceptional 97.4% |
| Sioux | 100.0 /100 | #28 | Exceptional 97.4% |
| Scandinavians | 100.0 /100 | #29 | Exceptional 97.4% |
| Czechs | 100.0 /100 | #30 | Exceptional 97.4% |
| Europeans | 100.0 /100 | #31 | Exceptional 97.3% |
| Italians | 100.0 /100 | #32 | Exceptional 97.3% |
| Chippewa | 100.0 /100 | #33 | Exceptional 97.3% |
| Alaska Natives | 100.0 /100 | #34 | Exceptional 97.3% |
| Swiss | 100.0 /100 | #35 | Exceptional 97.3% |
| Hungarians | 100.0 /100 | #36 | Exceptional 97.2% |