Immigrants from Hungary vs Immigrants from Uzbekistan Bachelor's Degree
COMPARE
Immigrants from Hungary
Immigrants from Uzbekistan
Bachelor's Degree
Bachelor's Degree Comparison
Immigrants from Hungary
Immigrants from Uzbekistan
42.3%
BACHELOR'S DEGREE
99.2/ 100
METRIC RATING
81st/ 347
METRIC RANK
42.8%
BACHELOR'S DEGREE
99.5/ 100
METRIC RATING
73rd/ 347
METRIC RANK
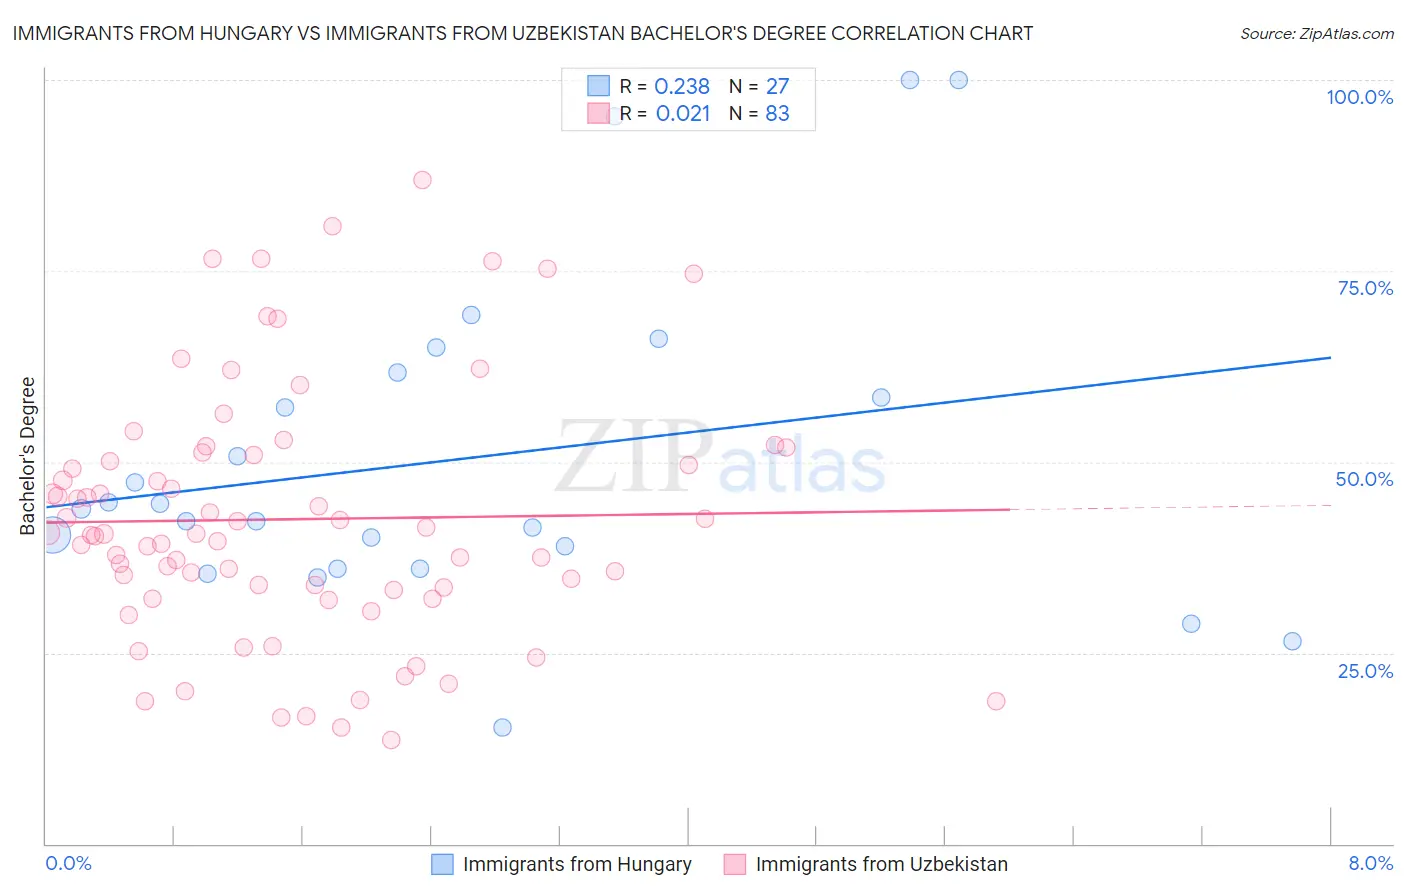
Immigrants from Hungary vs Immigrants from Uzbekistan Bachelor's Degree Correlation Chart
The statistical analysis conducted on geographies consisting of 195,704,422 people shows a weak positive correlation between the proportion of Immigrants from Hungary and percentage of population with at least bachelor's degree education in the United States with a correlation coefficient (R) of 0.238 and weighted average of 42.3%. Similarly, the statistical analysis conducted on geographies consisting of 118,752,495 people shows no correlation between the proportion of Immigrants from Uzbekistan and percentage of population with at least bachelor's degree education in the United States with a correlation coefficient (R) of 0.021 and weighted average of 42.8%, a difference of 1.1%.
Bachelor's Degree Correlation Summary
| Measurement | Immigrants from Hungary | Immigrants from Uzbekistan |
| Minimum | 15.2% | 13.6% |
| Maximum | 100.0% | 86.9% |
| Range | 84.8% | 73.3% |
| Mean | 50.5% | 42.5% |
| Median | 43.9% | 40.5% |
| Interquartile 25% (IQ1) | 36.1% | 33.2% |
| Interquartile 75% (IQ3) | 61.7% | 50.9% |
| Interquartile Range (IQR) | 25.6% | 17.6% |
| Standard Deviation (Sample) | 21.3% | 16.4% |
| Standard Deviation (Population) | 20.9% | 16.3% |
Demographics Similar to Immigrants from Hungary and Immigrants from Uzbekistan by Bachelor's Degree
In terms of bachelor's degree, the demographic groups most similar to Immigrants from Hungary are Immigrants from Croatia (42.3%, a difference of 0.020%), Immigrants from Scotland (42.3%, a difference of 0.070%), Armenian (42.3%, a difference of 0.10%), Immigrants from Western Asia (42.3%, a difference of 0.11%), and Lithuanian (42.2%, a difference of 0.14%). Similarly, the demographic groups most similar to Immigrants from Uzbekistan are Ethiopian (42.8%, a difference of 0.050%), Immigrants from Argentina (42.8%, a difference of 0.14%), Bhutanese (42.7%, a difference of 0.22%), Immigrants from Romania (42.9%, a difference of 0.40%), and Immigrants from Zimbabwe (42.6%, a difference of 0.44%).
| Demographics | Rating | Rank | Bachelor's Degree |
| Egyptians | 99.7 /100 | #67 | Exceptional 43.3% |
| Immigrants | Indonesia | 99.7 /100 | #68 | Exceptional 43.3% |
| Immigrants | Pakistan | 99.7 /100 | #69 | Exceptional 43.1% |
| Immigrants | Romania | 99.6 /100 | #70 | Exceptional 42.9% |
| Immigrants | Argentina | 99.6 /100 | #71 | Exceptional 42.8% |
| Ethiopians | 99.5 /100 | #72 | Exceptional 42.8% |
| Immigrants | Uzbekistan | 99.5 /100 | #73 | Exceptional 42.8% |
| Bhutanese | 99.5 /100 | #74 | Exceptional 42.7% |
| Immigrants | Zimbabwe | 99.4 /100 | #75 | Exceptional 42.6% |
| Immigrants | Egypt | 99.4 /100 | #76 | Exceptional 42.6% |
| Immigrants | Eastern Europe | 99.4 /100 | #77 | Exceptional 42.5% |
| Immigrants | Ethiopia | 99.4 /100 | #78 | Exceptional 42.5% |
| Immigrants | Lebanon | 99.3 /100 | #79 | Exceptional 42.4% |
| Immigrants | Croatia | 99.2 /100 | #80 | Exceptional 42.3% |
| Immigrants | Hungary | 99.2 /100 | #81 | Exceptional 42.3% |
| Immigrants | Scotland | 99.2 /100 | #82 | Exceptional 42.3% |
| Armenians | 99.2 /100 | #83 | Exceptional 42.3% |
| Immigrants | Western Asia | 99.2 /100 | #84 | Exceptional 42.3% |
| Lithuanians | 99.2 /100 | #85 | Exceptional 42.2% |
| Immigrants | Brazil | 99.2 /100 | #86 | Exceptional 42.2% |
| Carpatho Rusyns | 99.0 /100 | #87 | Exceptional 42.1% |