Immigrants from Haiti vs Pennsylvania German 7th Grade
COMPARE
Immigrants from Haiti
Pennsylvania German
7th Grade
7th Grade Comparison
Immigrants from Haiti
Pennsylvania Germans
94.3%
7TH GRADE
0.0/ 100
METRIC RATING
304th/ 347
METRIC RANK
97.6%
7TH GRADE
100.0/ 100
METRIC RATING
14th/ 347
METRIC RANK
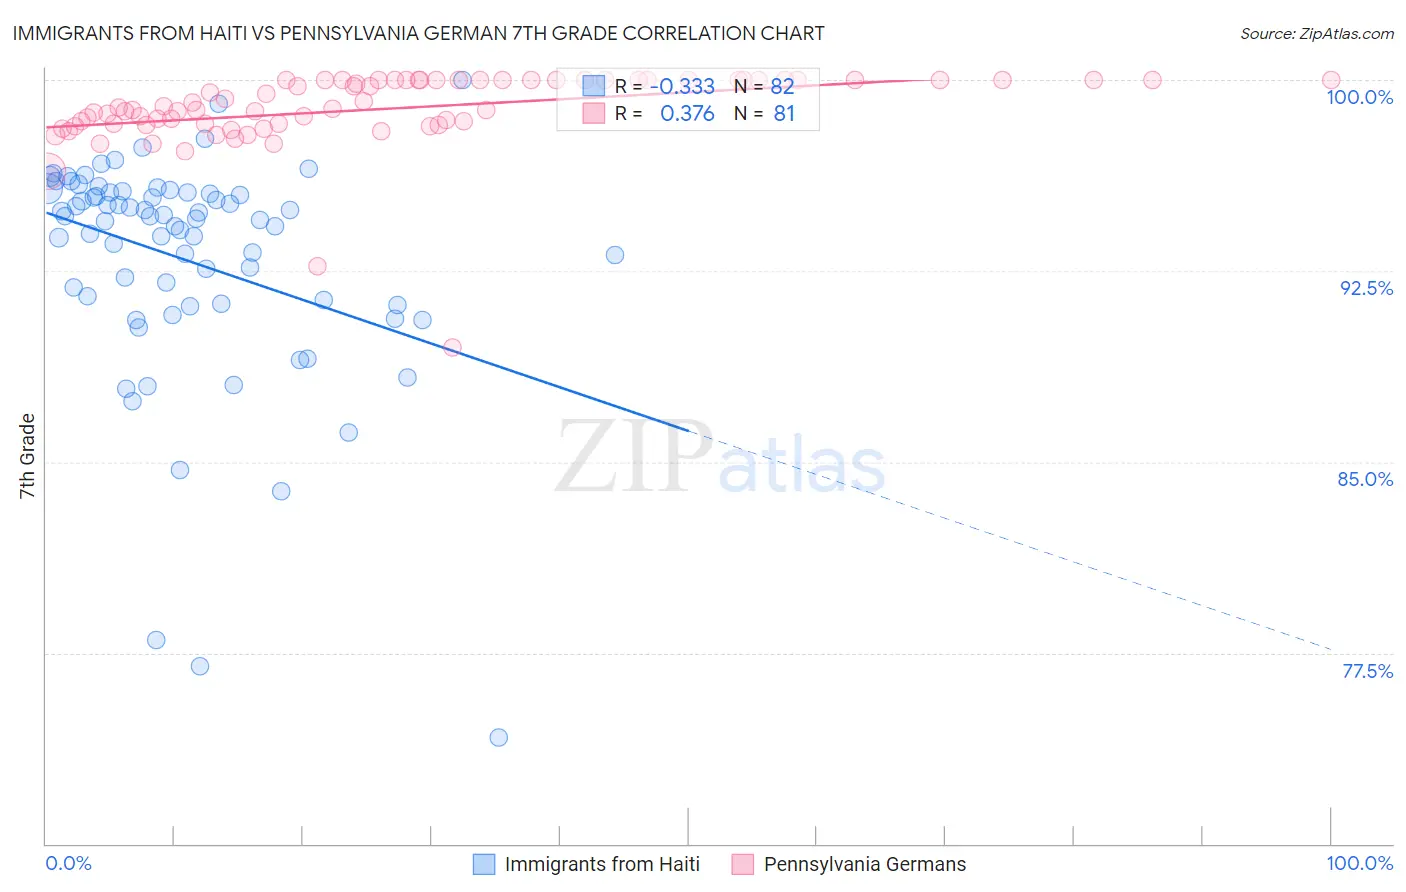
Immigrants from Haiti vs Pennsylvania German 7th Grade Correlation Chart
The statistical analysis conducted on geographies consisting of 225,287,083 people shows a mild negative correlation between the proportion of Immigrants from Haiti and percentage of population with at least 7th grade education in the United States with a correlation coefficient (R) of -0.333 and weighted average of 94.3%. Similarly, the statistical analysis conducted on geographies consisting of 234,102,588 people shows a mild positive correlation between the proportion of Pennsylvania Germans and percentage of population with at least 7th grade education in the United States with a correlation coefficient (R) of 0.376 and weighted average of 97.6%, a difference of 3.4%.
7th Grade Correlation Summary
| Measurement | Immigrants from Haiti | Pennsylvania German |
| Minimum | 74.2% | 89.5% |
| Maximum | 100.0% | 100.0% |
| Range | 25.8% | 10.5% |
| Mean | 92.9% | 98.9% |
| Median | 94.5% | 98.9% |
| Interquartile 25% (IQ1) | 91.2% | 98.2% |
| Interquartile 75% (IQ3) | 95.6% | 100.0% |
| Interquartile Range (IQR) | 4.4% | 1.8% |
| Standard Deviation (Sample) | 4.5% | 1.6% |
| Standard Deviation (Population) | 4.5% | 1.6% |
Similar Demographics by 7th Grade
Demographics Similar to Immigrants from Haiti by 7th Grade
In terms of 7th grade, the demographic groups most similar to Immigrants from Haiti are Guyanese (94.3%, a difference of 0.020%), Sri Lankan (94.4%, a difference of 0.030%), Immigrants from Dominica (94.5%, a difference of 0.12%), Immigrants from Laos (94.5%, a difference of 0.12%), and Immigrants from Burma/Myanmar (94.5%, a difference of 0.15%).
| Demographics | Rating | Rank | 7th Grade |
| Immigrants | South Eastern Asia | 0.0 /100 | #297 | Tragic 94.5% |
| Indonesians | 0.0 /100 | #298 | Tragic 94.5% |
| Bangladeshis | 0.0 /100 | #299 | Tragic 94.5% |
| Immigrants | Burma/Myanmar | 0.0 /100 | #300 | Tragic 94.5% |
| Immigrants | Dominica | 0.0 /100 | #301 | Tragic 94.5% |
| Immigrants | Laos | 0.0 /100 | #302 | Tragic 94.5% |
| Sri Lankans | 0.0 /100 | #303 | Tragic 94.4% |
| Immigrants | Haiti | 0.0 /100 | #304 | Tragic 94.3% |
| Guyanese | 0.0 /100 | #305 | Tragic 94.3% |
| Immigrants | Guyana | 0.0 /100 | #306 | Tragic 94.2% |
| Immigrants | Portugal | 0.0 /100 | #307 | Tragic 94.2% |
| Cape Verdeans | 0.0 /100 | #308 | Tragic 94.1% |
| Ecuadorians | 0.0 /100 | #309 | Tragic 94.0% |
| Immigrants | Caribbean | 0.0 /100 | #310 | Tragic 94.0% |
| Puerto Ricans | 0.0 /100 | #311 | Tragic 94.0% |
Demographics Similar to Pennsylvania Germans by 7th Grade
In terms of 7th grade, the demographic groups most similar to Pennsylvania Germans are Swedish (97.6%, a difference of 0.010%), English (97.6%, a difference of 0.010%), Polish (97.6%, a difference of 0.040%), Alaskan Athabascan (97.6%, a difference of 0.050%), and Slovene (97.6%, a difference of 0.060%).
| Demographics | Rating | Rank | 7th Grade |
| Norwegians | 100.0 /100 | #7 | Exceptional 97.8% |
| Slovaks | 100.0 /100 | #8 | Exceptional 97.8% |
| Germans | 100.0 /100 | #9 | Exceptional 97.7% |
| Slovenes | 100.0 /100 | #10 | Exceptional 97.6% |
| Alaskan Athabascans | 100.0 /100 | #11 | Exceptional 97.6% |
| Poles | 100.0 /100 | #12 | Exceptional 97.6% |
| Swedes | 100.0 /100 | #13 | Exceptional 97.6% |
| Pennsylvania Germans | 100.0 /100 | #14 | Exceptional 97.6% |
| English | 100.0 /100 | #15 | Exceptional 97.6% |
| Irish | 100.0 /100 | #16 | Exceptional 97.5% |
| Scottish | 100.0 /100 | #17 | Exceptional 97.5% |
| Tlingit-Haida | 100.0 /100 | #18 | Exceptional 97.5% |
| Lithuanians | 100.0 /100 | #19 | Exceptional 97.5% |
| Yup'ik | 100.0 /100 | #20 | Exceptional 97.4% |
| Inupiat | 100.0 /100 | #21 | Exceptional 97.4% |