Immigrants from Haiti vs White/Caucasian 7th Grade
COMPARE
Immigrants from Haiti
White/Caucasian
7th Grade
7th Grade Comparison
Immigrants from Haiti
Whites/Caucasians
94.3%
7TH GRADE
0.0/ 100
METRIC RATING
304th/ 347
METRIC RANK
97.0%
7TH GRADE
99.8/ 100
METRIC RATING
58th/ 347
METRIC RANK
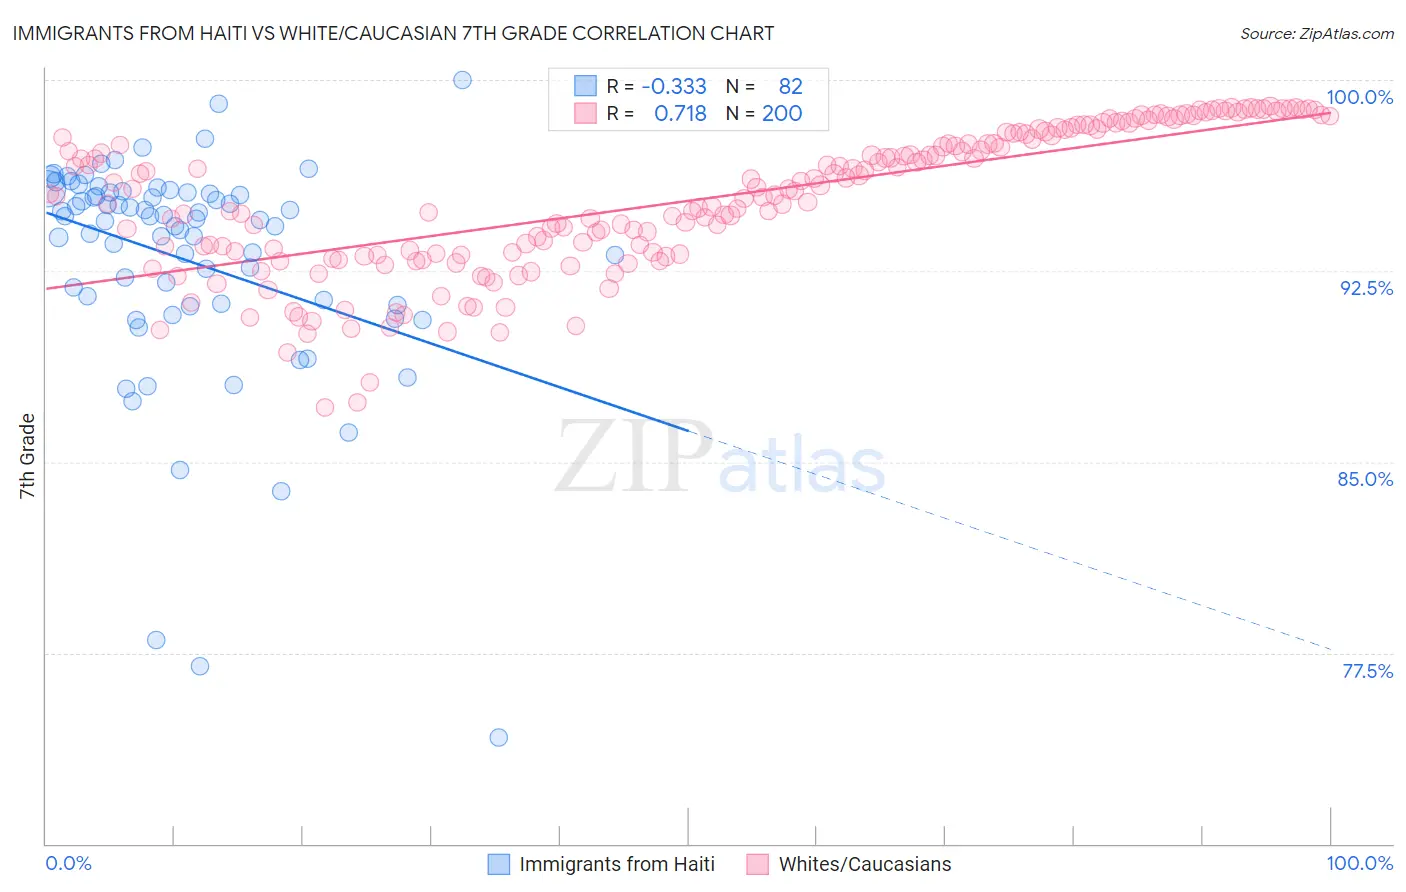
Immigrants from Haiti vs White/Caucasian 7th Grade Correlation Chart
The statistical analysis conducted on geographies consisting of 225,287,083 people shows a mild negative correlation between the proportion of Immigrants from Haiti and percentage of population with at least 7th grade education in the United States with a correlation coefficient (R) of -0.333 and weighted average of 94.3%. Similarly, the statistical analysis conducted on geographies consisting of 585,247,077 people shows a strong positive correlation between the proportion of Whites/Caucasians and percentage of population with at least 7th grade education in the United States with a correlation coefficient (R) of 0.718 and weighted average of 97.0%, a difference of 2.8%.
7th Grade Correlation Summary
| Measurement | Immigrants from Haiti | White/Caucasian |
| Minimum | 74.2% | 87.2% |
| Maximum | 100.0% | 99.0% |
| Range | 25.8% | 11.8% |
| Mean | 92.9% | 95.3% |
| Median | 94.5% | 95.5% |
| Interquartile 25% (IQ1) | 91.2% | 93.2% |
| Interquartile 75% (IQ3) | 95.6% | 97.8% |
| Interquartile Range (IQR) | 4.4% | 4.6% |
| Standard Deviation (Sample) | 4.5% | 2.8% |
| Standard Deviation (Population) | 4.5% | 2.8% |
Similar Demographics by 7th Grade
Demographics Similar to Immigrants from Haiti by 7th Grade
In terms of 7th grade, the demographic groups most similar to Immigrants from Haiti are Guyanese (94.3%, a difference of 0.020%), Sri Lankan (94.4%, a difference of 0.030%), Immigrants from Dominica (94.5%, a difference of 0.12%), Immigrants from Laos (94.5%, a difference of 0.12%), and Immigrants from Burma/Myanmar (94.5%, a difference of 0.15%).
| Demographics | Rating | Rank | 7th Grade |
| Immigrants | South Eastern Asia | 0.0 /100 | #297 | Tragic 94.5% |
| Indonesians | 0.0 /100 | #298 | Tragic 94.5% |
| Bangladeshis | 0.0 /100 | #299 | Tragic 94.5% |
| Immigrants | Burma/Myanmar | 0.0 /100 | #300 | Tragic 94.5% |
| Immigrants | Dominica | 0.0 /100 | #301 | Tragic 94.5% |
| Immigrants | Laos | 0.0 /100 | #302 | Tragic 94.5% |
| Sri Lankans | 0.0 /100 | #303 | Tragic 94.4% |
| Immigrants | Haiti | 0.0 /100 | #304 | Tragic 94.3% |
| Guyanese | 0.0 /100 | #305 | Tragic 94.3% |
| Immigrants | Guyana | 0.0 /100 | #306 | Tragic 94.2% |
| Immigrants | Portugal | 0.0 /100 | #307 | Tragic 94.2% |
| Cape Verdeans | 0.0 /100 | #308 | Tragic 94.1% |
| Ecuadorians | 0.0 /100 | #309 | Tragic 94.0% |
| Immigrants | Caribbean | 0.0 /100 | #310 | Tragic 94.0% |
| Puerto Ricans | 0.0 /100 | #311 | Tragic 94.0% |
Demographics Similar to Whites/Caucasians by 7th Grade
In terms of 7th grade, the demographic groups most similar to Whites/Caucasians are Macedonian (97.0%, a difference of 0.0%), American (97.0%, a difference of 0.010%), Immigrants from Canada (96.9%, a difference of 0.010%), Creek (96.9%, a difference of 0.010%), and Russian (97.0%, a difference of 0.020%).
| Demographics | Rating | Rank | 7th Grade |
| Estonians | 99.9 /100 | #51 | Exceptional 97.0% |
| Greeks | 99.9 /100 | #52 | Exceptional 97.0% |
| Austrians | 99.8 /100 | #53 | Exceptional 97.0% |
| Australians | 99.8 /100 | #54 | Exceptional 97.0% |
| Russians | 99.8 /100 | #55 | Exceptional 97.0% |
| Serbians | 99.8 /100 | #56 | Exceptional 97.0% |
| Americans | 99.8 /100 | #57 | Exceptional 97.0% |
| Whites/Caucasians | 99.8 /100 | #58 | Exceptional 97.0% |
| Macedonians | 99.8 /100 | #59 | Exceptional 97.0% |
| Immigrants | Canada | 99.8 /100 | #60 | Exceptional 96.9% |
| Creek | 99.8 /100 | #61 | Exceptional 96.9% |
| Immigrants | North America | 99.8 /100 | #62 | Exceptional 96.9% |
| Immigrants | Northern Europe | 99.7 /100 | #63 | Exceptional 96.9% |
| Immigrants | Austria | 99.7 /100 | #64 | Exceptional 96.9% |
| Canadians | 99.7 /100 | #65 | Exceptional 96.9% |