Immigrants from Haiti vs Immigrants from Afghanistan 2nd Grade
COMPARE
Immigrants from Haiti
Immigrants from Afghanistan
2nd Grade
2nd Grade Comparison
Immigrants from Haiti
Immigrants from Afghanistan
96.8%
2ND GRADE
0.0/ 100
METRIC RATING
308th/ 347
METRIC RANK
97.2%
2ND GRADE
0.0/ 100
METRIC RATING
291st/ 347
METRIC RANK
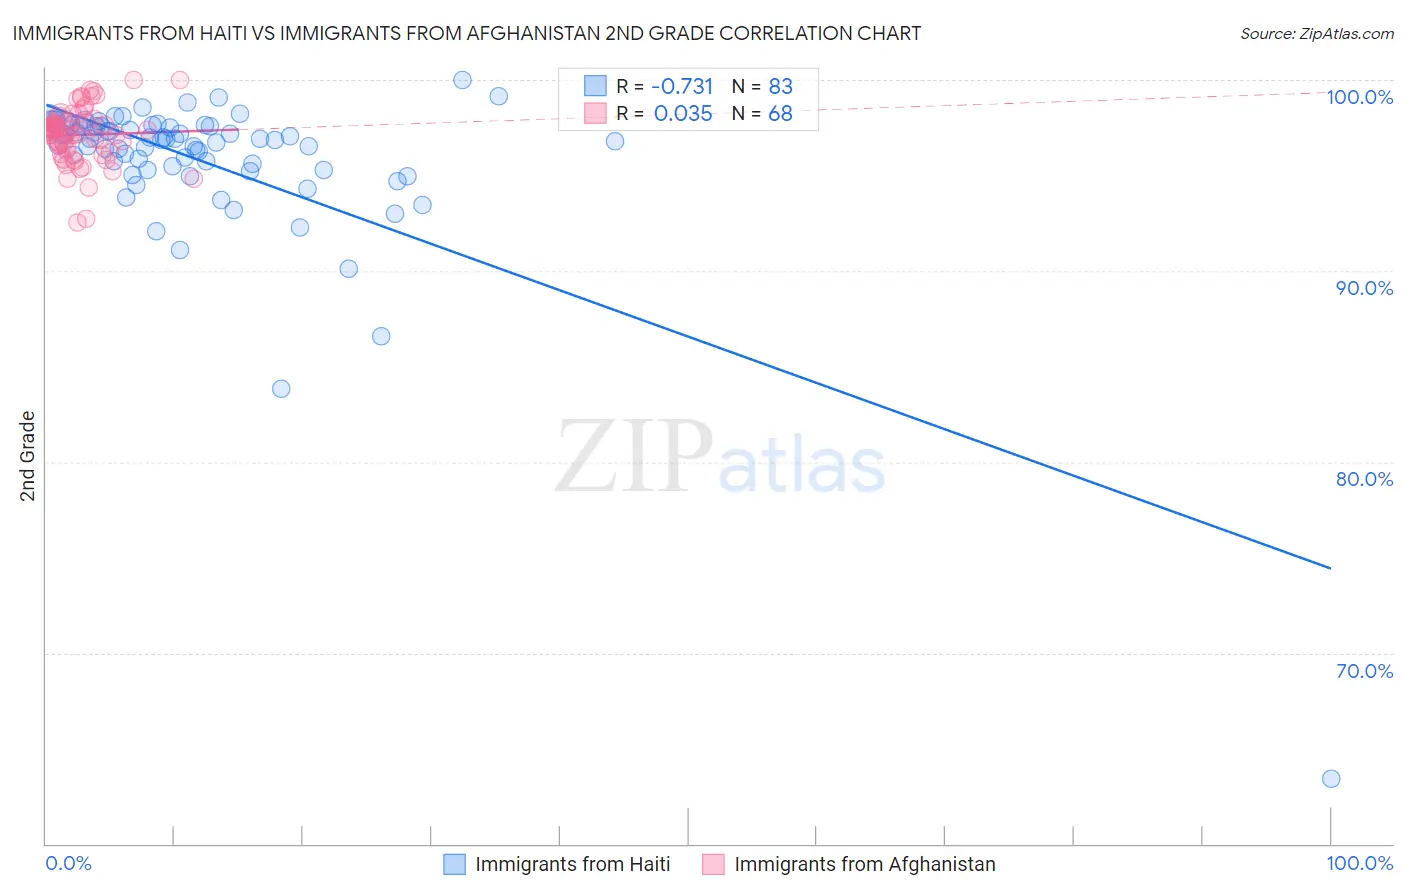
Immigrants from Haiti vs Immigrants from Afghanistan 2nd Grade Correlation Chart
The statistical analysis conducted on geographies consisting of 225,286,718 people shows a strong negative correlation between the proportion of Immigrants from Haiti and percentage of population with at least 2nd grade education in the United States with a correlation coefficient (R) of -0.731 and weighted average of 96.8%. Similarly, the statistical analysis conducted on geographies consisting of 147,629,924 people shows no correlation between the proportion of Immigrants from Afghanistan and percentage of population with at least 2nd grade education in the United States with a correlation coefficient (R) of 0.035 and weighted average of 97.2%, a difference of 0.36%.
2nd Grade Correlation Summary
| Measurement | Immigrants from Haiti | Immigrants from Afghanistan |
| Minimum | 63.4% | 92.5% |
| Maximum | 100.0% | 100.0% |
| Range | 36.6% | 7.5% |
| Mean | 95.8% | 97.1% |
| Median | 96.8% | 97.3% |
| Interquartile 25% (IQ1) | 95.3% | 96.3% |
| Interquartile 75% (IQ3) | 97.6% | 97.8% |
| Interquartile Range (IQR) | 2.3% | 1.6% |
| Standard Deviation (Sample) | 4.4% | 1.5% |
| Standard Deviation (Population) | 4.3% | 1.5% |
Demographics Similar to Immigrants from Haiti and Immigrants from Afghanistan by 2nd Grade
In terms of 2nd grade, the demographic groups most similar to Immigrants from Haiti are Immigrants from the Azores (96.8%, a difference of 0.010%), Belizean (96.8%, a difference of 0.010%), Immigrants from Somalia (96.9%, a difference of 0.040%), Nicaraguan (96.9%, a difference of 0.050%), and Immigrants from Caribbean (96.9%, a difference of 0.070%). Similarly, the demographic groups most similar to Immigrants from Afghanistan are Immigrants from St. Vincent and the Grenadines (97.2%, a difference of 0.0%), Houma (97.2%, a difference of 0.010%), Immigrants from Eritrea (97.2%, a difference of 0.020%), British West Indian (97.2%, a difference of 0.040%), and Malaysian (97.1%, a difference of 0.060%).
| Demographics | Rating | Rank | 2nd Grade |
| Houma | 0.0 /100 | #289 | Tragic 97.2% |
| Immigrants | St. Vincent and the Grenadines | 0.0 /100 | #290 | Tragic 97.2% |
| Immigrants | Afghanistan | 0.0 /100 | #291 | Tragic 97.2% |
| Immigrants | Eritrea | 0.0 /100 | #292 | Tragic 97.2% |
| British West Indians | 0.0 /100 | #293 | Tragic 97.2% |
| Malaysians | 0.0 /100 | #294 | Tragic 97.1% |
| Immigrants | Grenada | 0.0 /100 | #295 | Tragic 97.1% |
| Immigrants | Immigrants | 0.0 /100 | #296 | Tragic 97.1% |
| Immigrants | Cuba | 0.0 /100 | #297 | Tragic 97.0% |
| Immigrants | Dominica | 0.0 /100 | #298 | Tragic 97.0% |
| Haitians | 0.0 /100 | #299 | Tragic 97.0% |
| Immigrants | South Eastern Asia | 0.0 /100 | #300 | Tragic 97.0% |
| Central American Indians | 0.0 /100 | #301 | Tragic 97.0% |
| Somalis | 0.0 /100 | #302 | Tragic 97.0% |
| Ecuadorians | 0.0 /100 | #303 | Tragic 96.9% |
| Immigrants | Caribbean | 0.0 /100 | #304 | Tragic 96.9% |
| Nicaraguans | 0.0 /100 | #305 | Tragic 96.9% |
| Immigrants | Somalia | 0.0 /100 | #306 | Tragic 96.9% |
| Immigrants | Azores | 0.0 /100 | #307 | Tragic 96.8% |
| Immigrants | Haiti | 0.0 /100 | #308 | Tragic 96.8% |
| Belizeans | 0.0 /100 | #309 | Tragic 96.8% |