Sioux vs Immigrants from Oceania Nursery School
COMPARE
Sioux
Immigrants from Oceania
Nursery School
Nursery School Comparison
Sioux
Immigrants from Oceania
98.6%
NURSERY SCHOOL
100.0/ 100
METRIC RATING
26th/ 347
METRIC RANK
97.8%
NURSERY SCHOOL
10.2/ 100
METRIC RATING
210th/ 347
METRIC RANK
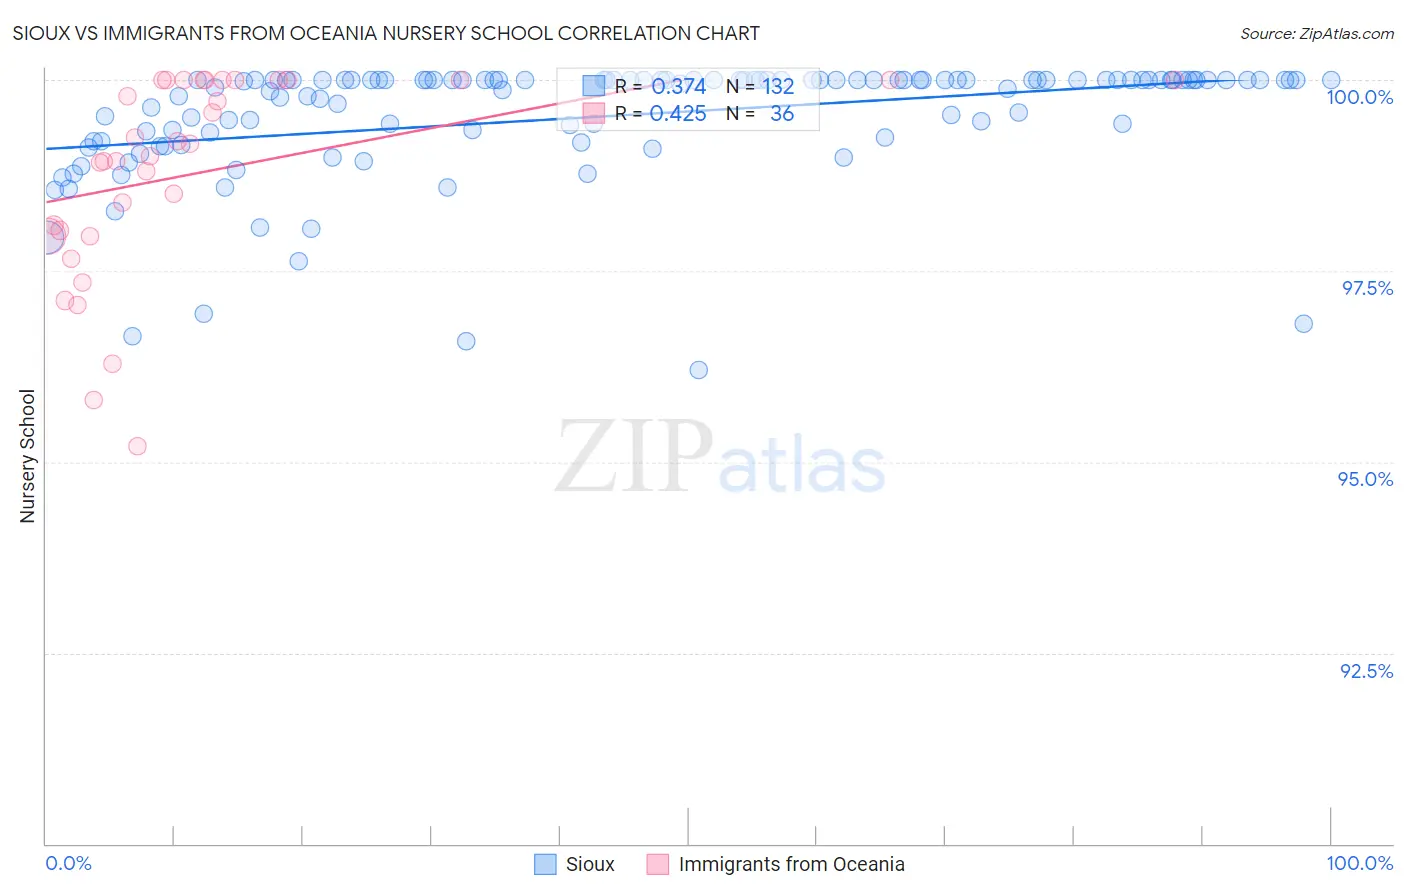
Sioux vs Immigrants from Oceania Nursery School Correlation Chart
The statistical analysis conducted on geographies consisting of 234,197,392 people shows a mild positive correlation between the proportion of Sioux and percentage of population with at least nursery school education in the United States with a correlation coefficient (R) of 0.374 and weighted average of 98.6%. Similarly, the statistical analysis conducted on geographies consisting of 305,516,300 people shows a moderate positive correlation between the proportion of Immigrants from Oceania and percentage of population with at least nursery school education in the United States with a correlation coefficient (R) of 0.425 and weighted average of 97.8%, a difference of 0.82%.
Nursery School Correlation Summary
| Measurement | Sioux | Immigrants from Oceania |
| Minimum | 96.2% | 95.2% |
| Maximum | 100.0% | 100.0% |
| Range | 3.8% | 4.8% |
| Mean | 99.5% | 98.8% |
| Median | 100.0% | 99.1% |
| Interquartile 25% (IQ1) | 99.2% | 98.0% |
| Interquartile 75% (IQ3) | 100.0% | 100.0% |
| Interquartile Range (IQR) | 0.77% | 2.0% |
| Standard Deviation (Sample) | 0.79% | 1.3% |
| Standard Deviation (Population) | 0.78% | 1.3% |
Similar Demographics by Nursery School
Demographics Similar to Sioux by Nursery School
In terms of nursery school, the demographic groups most similar to Sioux are Polish (98.6%, a difference of 0.0%), Danish (98.6%, a difference of 0.0%), Scotch-Irish (98.6%, a difference of 0.0%), Arapaho (98.6%, a difference of 0.0%), and Pennsylvania German (98.6%, a difference of 0.010%).
| Demographics | Rating | Rank | Nursery School |
| Irish | 100.0 /100 | #19 | Exceptional 98.6% |
| Pennsylvania Germans | 100.0 /100 | #20 | Exceptional 98.6% |
| Finns | 100.0 /100 | #21 | Exceptional 98.6% |
| Lithuanians | 100.0 /100 | #22 | Exceptional 98.6% |
| Poles | 100.0 /100 | #23 | Exceptional 98.6% |
| Danes | 100.0 /100 | #24 | Exceptional 98.6% |
| Scotch-Irish | 100.0 /100 | #25 | Exceptional 98.6% |
| Sioux | 100.0 /100 | #26 | Exceptional 98.6% |
| Arapaho | 100.0 /100 | #27 | Exceptional 98.6% |
| Croatians | 100.0 /100 | #28 | Exceptional 98.6% |
| French | 100.0 /100 | #29 | Exceptional 98.6% |
| Europeans | 100.0 /100 | #30 | Exceptional 98.6% |
| Czechs | 100.0 /100 | #31 | Exceptional 98.6% |
| French Canadians | 100.0 /100 | #32 | Exceptional 98.6% |
| Scandinavians | 100.0 /100 | #33 | Exceptional 98.6% |
Demographics Similar to Immigrants from Oceania by Nursery School
In terms of nursery school, the demographic groups most similar to Immigrants from Oceania are Laotian (97.8%, a difference of 0.0%), Immigrants from Northern Africa (97.8%, a difference of 0.010%), Costa Rican (97.8%, a difference of 0.010%), Immigrants from Bahamas (97.8%, a difference of 0.010%), and Moroccan (97.8%, a difference of 0.020%).
| Demographics | Rating | Rank | Nursery School |
| Immigrants | Uganda | 18.0 /100 | #203 | Poor 97.9% |
| Immigrants | Southern Europe | 17.4 /100 | #204 | Poor 97.9% |
| Immigrants | Chile | 17.3 /100 | #205 | Poor 97.9% |
| Immigrants | Albania | 16.4 /100 | #206 | Poor 97.9% |
| Africans | 15.4 /100 | #207 | Poor 97.9% |
| Immigrants | Northern Africa | 11.7 /100 | #208 | Poor 97.8% |
| Costa Ricans | 11.3 /100 | #209 | Poor 97.8% |
| Immigrants | Oceania | 10.2 /100 | #210 | Poor 97.8% |
| Laotians | 9.8 /100 | #211 | Tragic 97.8% |
| Immigrants | Bahamas | 8.6 /100 | #212 | Tragic 97.8% |
| Moroccans | 8.3 /100 | #213 | Tragic 97.8% |
| South American Indians | 8.0 /100 | #214 | Tragic 97.8% |
| Bahamians | 7.4 /100 | #215 | Tragic 97.8% |
| Uruguayans | 7.1 /100 | #216 | Tragic 97.8% |
| Samoans | 6.3 /100 | #217 | Tragic 97.8% |