Immigrants from Guyana vs Immigrants from Oceania Disability Age 35 to 64

COMPARE

Immigrants from Guyana
Race
Ancestry
AfghanAfricanAlaska NativeAlaskan AthabascanAlbanianAleutAlsatianAmericanApacheArabArapahoArgentineanArmenianAssyrian/Chaldean/SyriacAustralianAustrianBahamianBangladeshiBarbadianBasqueBelgianBelizeanBermudanBhutaneseBlackfeetBolivianBrazilianBritishBritish West IndianBulgarianBurmeseCajunCambodianCanadianCape VerdeanCarpatho RusynCelticCentral AmericanCentral American IndianCherokeeCheyenneChickasawChileanChineseChippewaChoctawColombianColvilleComancheCosta RicanCreeCreekCroatianCrowCubanCypriotCzechCzechoslovakianDanishDelawareDominicanDutchDutch West IndianEastern EuropeanEcuadorianEgyptianEnglishEstonianEthiopianEuropeanFijianFilipinoFinnishFrenchFrench American IndianFrench CanadianGermanGerman RussianGhanaianGreekGuamanian/ChamorroGuatemalanGuyaneseHaitianHmongHonduranHopiHoumaHungarianIcelanderIndian (Asian)IndonesianInupiatIranianIraqiIrishIroquoisIsraeliItalianJamaicanJapaneseJordanianKenyanKiowaKoreanLaotianLatvianLebaneseLiberianLithuanianLumbeeLuxembourgerMacedonianMalaysianMalteseMarshalleseMenomineeMexicanMexican American IndianMongolianMoroccanNative HawaiianNavajoNepaleseNew ZealanderNicaraguanNigerianNorthern EuropeanNorwegianOkinawanOsageOttawaPaiutePakistaniPalestinianPanamanianParaguayanPennsylvania GermanPeruvianPimaPolishPortuguesePotawatomiPuebloPuerto RicanPuget Sound SalishRomanianRussianSalvadoranSamoanScandinavianScotch-IrishScottishSeminoleSenegaleseSerbianShoshoneSierra LeoneanSiouxSlavicSlovakSloveneSomaliSouth AfricanSouth AmericanSouth American IndianSoviet UnionSpaniardSpanishSpanish AmericanSpanish American IndianSri LankanSubsaharan AfricanSudaneseSwedishSwissSyrianTaiwaneseThaiTlingit-HaidaTohono O'OdhamTonganTrinidadian and TobagonianTsimshianTurkishU.S. Virgin IslanderUgandanUkrainianUruguayanUteVenezuelanVietnameseWelshWest IndianYakamaYaquiYugoslavianYumanYup'ikZimbabwean
Immigration
NonimmigrantsImmigrantsAfghanistanAfricaAlbaniaArgentinaArmeniaAsiaAustraliaAustriaBahamasBangladeshBarbadosBelarusBelgiumBelizeBoliviaBosnia and HerzegovinaBrazilBulgariaBurma/MyanmarCabo VerdeCambodiaCameroonCanadaCaribbeanCentral AmericaChileChinaColombiaCongoCosta RicaCroatiaCubaCzechoslovakiaDenmarkDominicaDominican RepublicEastern AfricaEastern AsiaEastern EuropeEcuadorEgyptEl SalvadorEnglandEritreaEthiopiaEuropeFijiFranceGermanyGhanaGreeceGrenadaGuatemalaGuyanaHaitiHondurasHong KongHungaryIndiaIndonesiaIranIraqIrelandIsraelItalyJamaicaJapanJordanKazakhstanKenyaKoreaKuwaitLaosLatin AmericaLatviaLebanonLiberiaLithuaniaMalaysiaMexicoMicronesiaMiddle AfricaMoldovaMoroccoNepalNetherlandsNicaraguaNigeriaNorth AmericaNorth MacedoniaNorthern AfricaNorthern EuropeNorwayPakistanPanamaPeruPhilippinesPolandPortugalRomaniaRussiaSaudi ArabiaScotlandSenegalSerbiaSierra LeoneSingaporeSomaliaSouth AfricaSouth AmericaSouth Central AsiaSouth Eastern AsiaSouthern EuropeSpainSri LankaSt. Vincent and the GrenadinesSudanSwedenSwitzerlandSyriaTaiwanThailandTrinidad and TobagoTurkeyUgandaUkraineUruguayUzbekistanVenezuelaVietnamWest IndiesWestern AfricaWestern AsiaWestern EuropeYemenZaireZimbabweAzores
Immigrants from Oceania
Race
Ancestry
AfghanAfricanAlaska NativeAlaskan AthabascanAlbanianAleutAlsatianAmericanApacheArabArapahoArgentineanArmenianAssyrian/Chaldean/SyriacAustralianAustrianBahamianBangladeshiBarbadianBasqueBelgianBelizeanBermudanBhutaneseBlackfeetBolivianBrazilianBritishBritish West IndianBulgarianBurmeseCajunCambodianCanadianCape VerdeanCarpatho RusynCelticCentral AmericanCentral American IndianCherokeeCheyenneChickasawChileanChineseChippewaChoctawColombianColvilleComancheCosta RicanCreeCreekCroatianCrowCubanCypriotCzechCzechoslovakianDanishDelawareDominicanDutchDutch West IndianEastern EuropeanEcuadorianEgyptianEnglishEstonianEthiopianEuropeanFijianFilipinoFinnishFrenchFrench American IndianFrench CanadianGermanGerman RussianGhanaianGreekGuamanian/ChamorroGuatemalanGuyaneseHaitianHmongHonduranHopiHoumaHungarianIcelanderIndian (Asian)IndonesianInupiatIranianIraqiIrishIroquoisIsraeliItalianJamaicanJapaneseJordanianKenyanKiowaKoreanLaotianLatvianLebaneseLiberianLithuanianLumbeeLuxembourgerMacedonianMalaysianMalteseMarshalleseMenomineeMexicanMexican American IndianMongolianMoroccanNative HawaiianNavajoNepaleseNew ZealanderNicaraguanNigerianNorthern EuropeanNorwegianOkinawanOsageOttawaPaiutePakistaniPalestinianPanamanianParaguayanPennsylvania GermanPeruvianPimaPolishPortuguesePotawatomiPuebloPuerto RicanPuget Sound SalishRomanianRussianSalvadoranSamoanScandinavianScotch-IrishScottishSeminoleSenegaleseSerbianShoshoneSierra LeoneanSiouxSlavicSlovakSloveneSomaliSouth AfricanSouth AmericanSouth American IndianSoviet UnionSpaniardSpanishSpanish AmericanSpanish American IndianSri LankanSubsaharan AfricanSudaneseSwedishSwissSyrianTaiwaneseThaiTlingit-HaidaTohono O'OdhamTonganTrinidadian and TobagonianTsimshianTurkishU.S. Virgin IslanderUgandanUkrainianUruguayanUteVenezuelanVietnameseWelshWest IndianYakamaYaquiYugoslavianYumanYup'ikZimbabwean
Immigration
NonimmigrantsImmigrantsAfghanistanAfricaAlbaniaArgentinaArmeniaAsiaAustraliaAustriaBahamasBangladeshBarbadosBelarusBelgiumBelizeBoliviaBosnia and HerzegovinaBrazilBulgariaBurma/MyanmarCabo VerdeCambodiaCameroonCanadaCaribbeanCentral AmericaChileChinaColombiaCongoCosta RicaCroatiaCubaCzechoslovakiaDenmarkDominicaDominican RepublicEastern AfricaEastern AsiaEastern EuropeEcuadorEgyptEl SalvadorEnglandEritreaEthiopiaEuropeFijiFranceGermanyGhanaGreeceGrenadaGuatemalaHaitiHondurasHong KongHungaryIndiaIndonesiaIranIraqIrelandIsraelItalyJamaicaJapanJordanKazakhstanKenyaKoreaKuwaitLaosLatin AmericaLatviaLebanonLiberiaLithuaniaMalaysiaMexicoMicronesiaMiddle AfricaMoldovaMoroccoNepalNetherlandsNicaraguaNigeriaNorth AmericaNorth MacedoniaNorthern AfricaNorthern EuropeNorwayOceaniaPakistanPanamaPeruPhilippinesPolandPortugalRomaniaRussiaSaudi ArabiaScotlandSenegalSerbiaSierra LeoneSingaporeSomaliaSouth AfricaSouth AmericaSouth Central AsiaSouth Eastern AsiaSouthern EuropeSpainSri LankaSt. Vincent and the GrenadinesSudanSwedenSwitzerlandSyriaTaiwanThailandTrinidad and TobagoTurkeyUgandaUkraineUruguayUzbekistanVenezuelaVietnamWest IndiesWestern AfricaWestern AsiaWestern EuropeYemenZaireZimbabweAzores
Disability Age 35 to 64
Income
Poverty
Unemployment
Labor Participation
Family Structure
Vehicle Availability
Education Level
Disability

Disability Age 35 to 64 Comparison

Immigrants from Guyana

Immigrants from Oceania

Good
Fair
11.1%
DISABILITY AGE 35 TO 64
70.1/ 100
METRIC RATING
161st/ 347
METRIC RANK
11.4%
DISABILITY AGE 35 TO 64
39.5/ 100
METRIC RATING
183rd/ 347
METRIC RANK

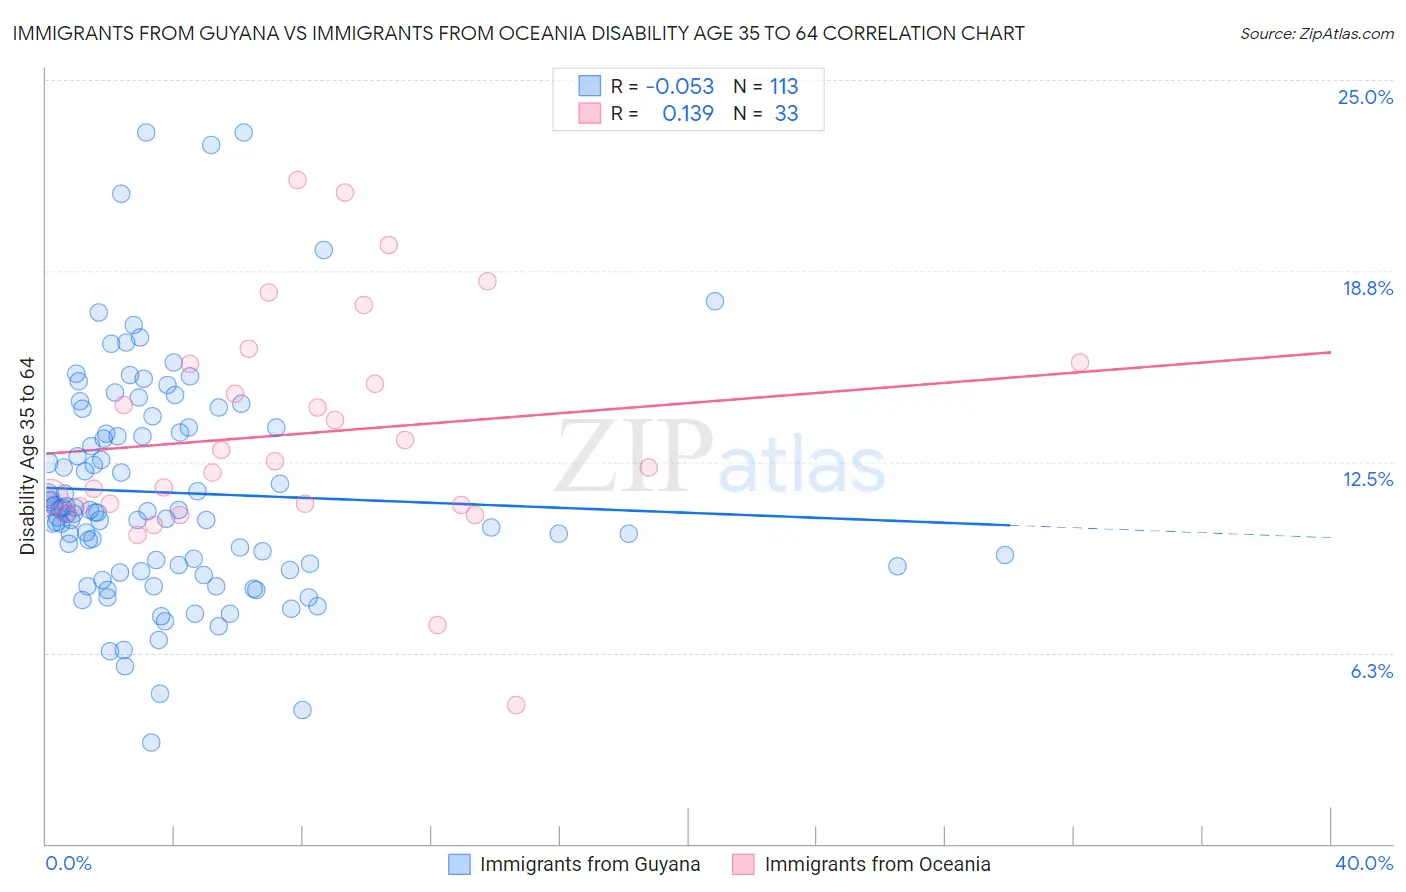
Immigrants from Guyana vs Immigrants from Oceania Disability Age 35 to 64 Correlation Chart

The statistical analysis conducted on geographies consisting of 183,673,552 people shows a slight negative correlation between the proportion of Immigrants from Guyana and percentage of population with a disability between the ages 34 and 64 in the United States with a correlation coefficient (R) of -0.053 and weighted average of 11.1%. Similarly, the statistical analysis conducted on geographies consisting of 305,351,823 people shows a poor positive correlation between the proportion of Immigrants from Oceania and percentage of population with a disability between the ages 34 and 64 in the United States with a correlation coefficient (R) of 0.139 and weighted average of 11.4%, a difference of 2.6%.
Immigrants from Guyana vs Immigrants from Oceania Disability Age 35 to 64

Disability Age 35 to 64 Correlation Summary

MeasurementImmigrants from GuyanaImmigrants from Oceania
Minimum3.3%4.5%
Maximum23.3%21.7%
Range20.0%17.2%
Mean11.5%13.4%
Median10.9%12.5%
Interquartile 25% (IQ1)9.0%11.1%
Interquartile 75% (IQ3)13.5%15.7%
Interquartile Range (IQR)4.5%4.7%
Standard Deviation (Sample)3.7%3.8%
Standard Deviation (Population)3.7%3.7%

Similar Demographics by Disability Age 35 to 64

Demographics Similar to Immigrants from Guyana by Disability Age 35 to 64

In terms of disability age 35 to 64, the demographic groups most similar to Immigrants from Guyana are Immigrants from Grenada (11.1%, a difference of 0.17%), Croatian (11.0%, a difference of 0.30%), Immigrants from St. Vincent and the Grenadines (11.1%, a difference of 0.33%), Serbian (11.0%, a difference of 0.36%), and Pakistani (11.1%, a difference of 0.41%).
DemographicsRating | RankDisability Age 35 to 64
Immigrants | Canada
76.7
/100
|
#154
Good
11.0%
Moroccans
76.4
/100
|
#155
Good
11.0%
Immigrants | Sierra Leone
76.2
/100
|
#156
Good
11.0%
Guyanese
75.1
/100
|
#157
Good
11.0%
Immigrants | North America
74.9
/100
|
#158
Good
11.0%
Serbians
73.6
/100
|
#159
Good
11.0%
Croatians
73.1
/100
|
#160
Good
11.0%
Immigrants | Guyana
70.1
/100
|
#161
Good
11.1%
Immigrants | Grenada
68.4
/100
|
#162
Good
11.1%
Immigrants | St. Vincent and the Grenadines
66.6
/100
|
#163
Good
11.1%
Pakistanis
65.8
/100
|
#164
Good
11.1%
Immigrants | Western Europe
65.2
/100
|
#165
Good
11.1%
Immigrants | Haiti
63.8
/100
|
#166
Good
11.1%
Austrians
63.2
/100
|
#167
Good
11.1%
Central Americans
59.1
/100
|
#168
Average
11.2%

Demographics Similar to Immigrants from Oceania by Disability Age 35 to 64

In terms of disability age 35 to 64, the demographic groups most similar to Immigrants from Oceania are Icelander (11.4%, a difference of 0.020%), Kenyan (11.4%, a difference of 0.030%), Trinidadian and Tobagonian (11.4%, a difference of 0.10%), Immigrants from Barbados (11.3%, a difference of 0.17%), and Immigrants from Caribbean (11.3%, a difference of 0.17%).
DemographicsRating | RankDisability Age 35 to 64
Ugandans
43.7
/100
|
#176
Average
11.3%
Immigrants | Eastern Africa
42.2
/100
|
#177
Average
11.3%
Poles
42.0
/100
|
#178
Average
11.3%
Immigrants | Barbados
41.6
/100
|
#179
Average
11.3%
Immigrants | Caribbean
41.5
/100
|
#180
Average
11.3%
Trinidadians and Tobagonians
40.8
/100
|
#181
Average
11.4%
Icelanders
39.7
/100
|
#182
Fair
11.4%
Immigrants | Oceania
39.5
/100
|
#183
Fair
11.4%
Kenyans
39.2
/100
|
#184
Fair
11.4%
Danes
36.8
/100
|
#185
Fair
11.4%
Slovenes
36.6
/100
|
#186
Fair
11.4%
Immigrants | Bosnia and Herzegovina
35.2
/100
|
#187
Fair
11.4%
Northern Europeans
34.9
/100
|
#188
Fair
11.4%
Hungarians
34.6
/100
|
#189
Fair
11.4%
Immigrants | Nigeria
32.5
/100
|
#190
Fair
11.4%