Immigrants from Guatemala vs Afghan Master's Degree
COMPARE
Immigrants from Guatemala
Afghan
Master's Degree
Master's Degree Comparison
Immigrants from Guatemala
Afghans
11.6%
MASTER'S DEGREE
0.1/ 100
METRIC RATING
292nd/ 347
METRIC RANK
16.5%
MASTER'S DEGREE
96.2/ 100
METRIC RATING
121st/ 347
METRIC RANK
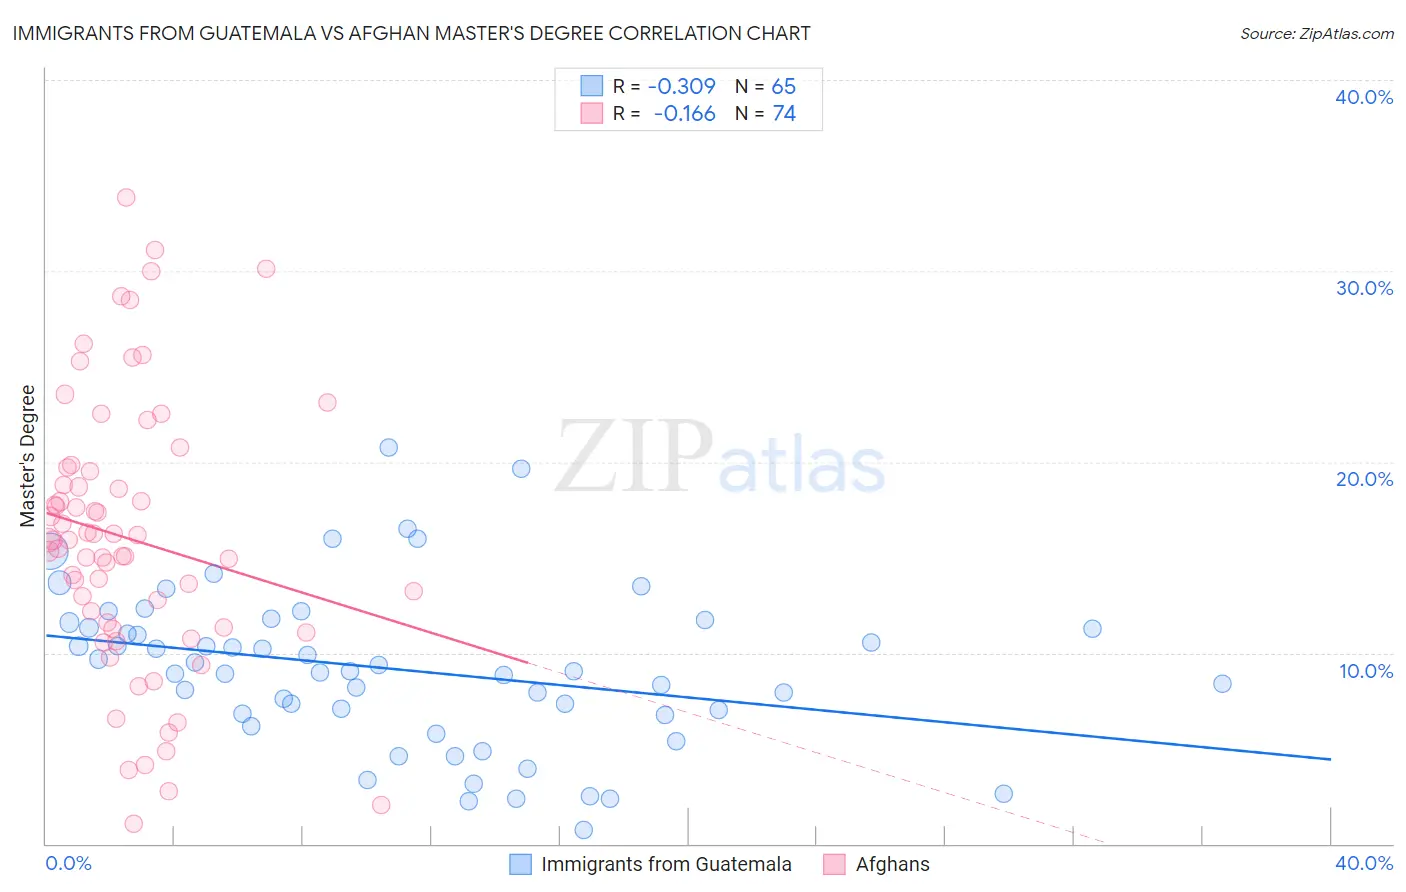
Immigrants from Guatemala vs Afghan Master's Degree Correlation Chart
The statistical analysis conducted on geographies consisting of 377,121,339 people shows a mild negative correlation between the proportion of Immigrants from Guatemala and percentage of population with at least master's degree education in the United States with a correlation coefficient (R) of -0.309 and weighted average of 11.6%. Similarly, the statistical analysis conducted on geographies consisting of 148,857,027 people shows a poor negative correlation between the proportion of Afghans and percentage of population with at least master's degree education in the United States with a correlation coefficient (R) of -0.166 and weighted average of 16.5%, a difference of 41.6%.
Master's Degree Correlation Summary
| Measurement | Immigrants from Guatemala | Afghan |
| Minimum | 0.73% | 1.0% |
| Maximum | 20.8% | 33.8% |
| Range | 20.0% | 32.8% |
| Mean | 9.1% | 16.0% |
| Median | 9.0% | 15.9% |
| Interquartile 25% (IQ1) | 6.8% | 11.3% |
| Interquartile 75% (IQ3) | 11.5% | 19.5% |
| Interquartile Range (IQR) | 4.7% | 8.2% |
| Standard Deviation (Sample) | 4.2% | 7.1% |
| Standard Deviation (Population) | 4.1% | 7.1% |
Similar Demographics by Master's Degree
Demographics Similar to Immigrants from Guatemala by Master's Degree
In terms of master's degree, the demographic groups most similar to Immigrants from Guatemala are Colville (11.6%, a difference of 0.13%), Alaska Native (11.6%, a difference of 0.23%), Hawaiian (11.6%, a difference of 0.32%), Marshallese (11.6%, a difference of 0.48%), and Alaskan Athabascan (11.6%, a difference of 0.48%).
| Demographics | Rating | Rank | Master's Degree |
| Immigrants | Nicaragua | 0.2 /100 | #285 | Tragic 11.8% |
| Aleuts | 0.1 /100 | #286 | Tragic 11.8% |
| Immigrants | Haiti | 0.1 /100 | #287 | Tragic 11.8% |
| Immigrants | Honduras | 0.1 /100 | #288 | Tragic 11.8% |
| Guatemalans | 0.1 /100 | #289 | Tragic 11.7% |
| Ute | 0.1 /100 | #290 | Tragic 11.7% |
| Colville | 0.1 /100 | #291 | Tragic 11.6% |
| Immigrants | Guatemala | 0.1 /100 | #292 | Tragic 11.6% |
| Alaska Natives | 0.1 /100 | #293 | Tragic 11.6% |
| Hawaiians | 0.1 /100 | #294 | Tragic 11.6% |
| Marshallese | 0.1 /100 | #295 | Tragic 11.6% |
| Alaskan Athabascans | 0.1 /100 | #296 | Tragic 11.6% |
| Immigrants | Yemen | 0.1 /100 | #297 | Tragic 11.6% |
| Samoans | 0.1 /100 | #298 | Tragic 11.5% |
| Chickasaw | 0.1 /100 | #299 | Tragic 11.4% |
Demographics Similar to Afghans by Master's Degree
In terms of master's degree, the demographic groups most similar to Afghans are Lebanese (16.5%, a difference of 0.20%), Jordanian (16.5%, a difference of 0.30%), British (16.4%, a difference of 0.43%), Croatian (16.4%, a difference of 0.44%), and Immigrants from Eritrea (16.4%, a difference of 0.52%).
| Demographics | Rating | Rank | Master's Degree |
| Northern Europeans | 97.6 /100 | #114 | Exceptional 16.7% |
| Immigrants | Uganda | 97.3 /100 | #115 | Exceptional 16.6% |
| Immigrants | Southern Europe | 97.2 /100 | #116 | Exceptional 16.6% |
| Immigrants | Moldova | 97.2 /100 | #117 | Exceptional 16.6% |
| Brazilians | 96.8 /100 | #118 | Exceptional 16.5% |
| Jordanians | 96.5 /100 | #119 | Exceptional 16.5% |
| Lebanese | 96.4 /100 | #120 | Exceptional 16.5% |
| Afghans | 96.2 /100 | #121 | Exceptional 16.5% |
| British | 95.6 /100 | #122 | Exceptional 16.4% |
| Croatians | 95.6 /100 | #123 | Exceptional 16.4% |
| Immigrants | Eritrea | 95.5 /100 | #124 | Exceptional 16.4% |
| Italians | 95.4 /100 | #125 | Exceptional 16.4% |
| Immigrants | Eastern Africa | 95.2 /100 | #126 | Exceptional 16.3% |
| Palestinians | 94.8 /100 | #127 | Exceptional 16.3% |
| Immigrants | Sierra Leone | 94.7 /100 | #128 | Exceptional 16.3% |