Immigrants from Guatemala vs Immigrants from Northern Europe Master's Degree
COMPARE
Immigrants from Guatemala
Immigrants from Northern Europe
Master's Degree
Master's Degree Comparison
Immigrants from Guatemala
Immigrants from Northern Europe
11.6%
MASTER'S DEGREE
0.1/ 100
METRIC RATING
292nd/ 347
METRIC RANK
19.5%
MASTER'S DEGREE
100.0/ 100
METRIC RATING
35th/ 347
METRIC RANK
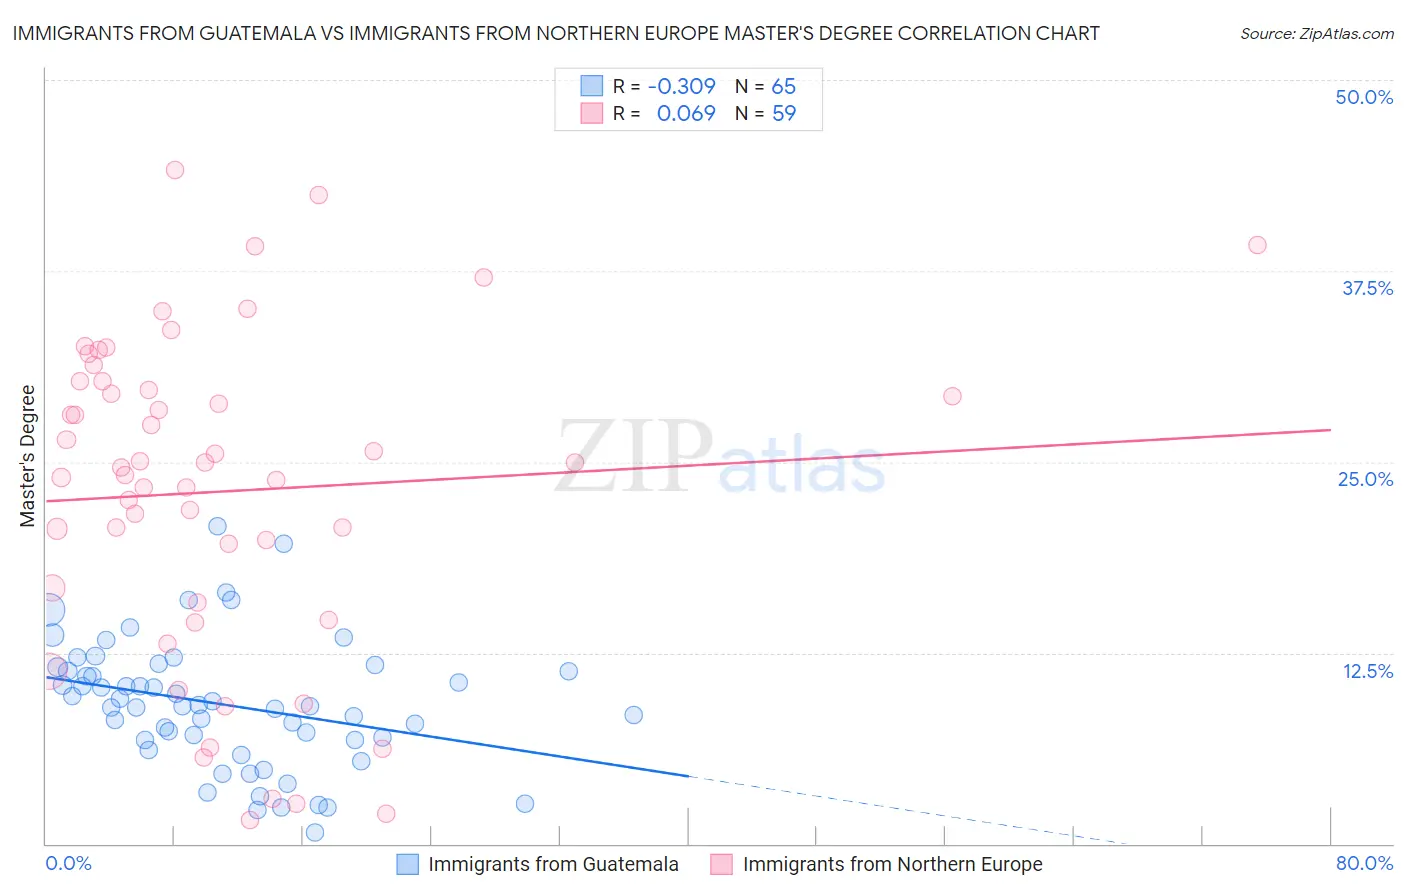
Immigrants from Guatemala vs Immigrants from Northern Europe Master's Degree Correlation Chart
The statistical analysis conducted on geographies consisting of 377,121,339 people shows a mild negative correlation between the proportion of Immigrants from Guatemala and percentage of population with at least master's degree education in the United States with a correlation coefficient (R) of -0.309 and weighted average of 11.6%. Similarly, the statistical analysis conducted on geographies consisting of 477,052,190 people shows a slight positive correlation between the proportion of Immigrants from Northern Europe and percentage of population with at least master's degree education in the United States with a correlation coefficient (R) of 0.069 and weighted average of 19.5%, a difference of 67.5%.
Master's Degree Correlation Summary
| Measurement | Immigrants from Guatemala | Immigrants from Northern Europe |
| Minimum | 0.73% | 1.5% |
| Maximum | 20.8% | 44.1% |
| Range | 20.0% | 42.6% |
| Mean | 9.1% | 23.1% |
| Median | 9.0% | 24.6% |
| Interquartile 25% (IQ1) | 6.8% | 15.8% |
| Interquartile 75% (IQ3) | 11.5% | 30.2% |
| Interquartile Range (IQR) | 4.7% | 14.4% |
| Standard Deviation (Sample) | 4.2% | 10.5% |
| Standard Deviation (Population) | 4.1% | 10.4% |
Similar Demographics by Master's Degree
Demographics Similar to Immigrants from Guatemala by Master's Degree
In terms of master's degree, the demographic groups most similar to Immigrants from Guatemala are Colville (11.6%, a difference of 0.13%), Alaska Native (11.6%, a difference of 0.23%), Hawaiian (11.6%, a difference of 0.32%), Marshallese (11.6%, a difference of 0.48%), and Alaskan Athabascan (11.6%, a difference of 0.48%).
| Demographics | Rating | Rank | Master's Degree |
| Immigrants | Nicaragua | 0.2 /100 | #285 | Tragic 11.8% |
| Aleuts | 0.1 /100 | #286 | Tragic 11.8% |
| Immigrants | Haiti | 0.1 /100 | #287 | Tragic 11.8% |
| Immigrants | Honduras | 0.1 /100 | #288 | Tragic 11.8% |
| Guatemalans | 0.1 /100 | #289 | Tragic 11.7% |
| Ute | 0.1 /100 | #290 | Tragic 11.7% |
| Colville | 0.1 /100 | #291 | Tragic 11.6% |
| Immigrants | Guatemala | 0.1 /100 | #292 | Tragic 11.6% |
| Alaska Natives | 0.1 /100 | #293 | Tragic 11.6% |
| Hawaiians | 0.1 /100 | #294 | Tragic 11.6% |
| Marshallese | 0.1 /100 | #295 | Tragic 11.6% |
| Alaskan Athabascans | 0.1 /100 | #296 | Tragic 11.6% |
| Immigrants | Yemen | 0.1 /100 | #297 | Tragic 11.6% |
| Samoans | 0.1 /100 | #298 | Tragic 11.5% |
| Chickasaw | 0.1 /100 | #299 | Tragic 11.4% |
Demographics Similar to Immigrants from Northern Europe by Master's Degree
In terms of master's degree, the demographic groups most similar to Immigrants from Northern Europe are Immigrants from Denmark (19.5%, a difference of 0.33%), Russian (19.5%, a difference of 0.36%), Immigrants from Russia (19.4%, a difference of 0.37%), Mongolian (19.4%, a difference of 0.41%), and Bolivian (19.3%, a difference of 1.1%).
| Demographics | Rating | Rank | Master's Degree |
| Turks | 100.0 /100 | #28 | Exceptional 19.9% |
| Latvians | 100.0 /100 | #29 | Exceptional 19.8% |
| Immigrants | Turkey | 100.0 /100 | #30 | Exceptional 19.7% |
| Immigrants | Korea | 100.0 /100 | #31 | Exceptional 19.7% |
| Burmese | 100.0 /100 | #32 | Exceptional 19.7% |
| Russians | 100.0 /100 | #33 | Exceptional 19.5% |
| Immigrants | Denmark | 100.0 /100 | #34 | Exceptional 19.5% |
| Immigrants | Northern Europe | 100.0 /100 | #35 | Exceptional 19.5% |
| Immigrants | Russia | 100.0 /100 | #36 | Exceptional 19.4% |
| Mongolians | 100.0 /100 | #37 | Exceptional 19.4% |
| Bolivians | 100.0 /100 | #38 | Exceptional 19.3% |
| Immigrants | Spain | 100.0 /100 | #39 | Exceptional 19.1% |
| Immigrants | Bolivia | 100.0 /100 | #40 | Exceptional 19.1% |
| Immigrants | Latvia | 100.0 /100 | #41 | Exceptional 19.1% |
| Immigrants | Saudi Arabia | 100.0 /100 | #42 | Exceptional 19.0% |