Immigrants from Guatemala vs Spanish Doctorate Degree
COMPARE
Immigrants from Guatemala
Spanish
Doctorate Degree
Doctorate Degree Comparison
Immigrants from Guatemala
Spanish
1.4%
DOCTORATE DEGREE
0.1/ 100
METRIC RATING
300th/ 347
METRIC RANK
1.8%
DOCTORATE DEGREE
49.3/ 100
METRIC RATING
176th/ 347
METRIC RANK
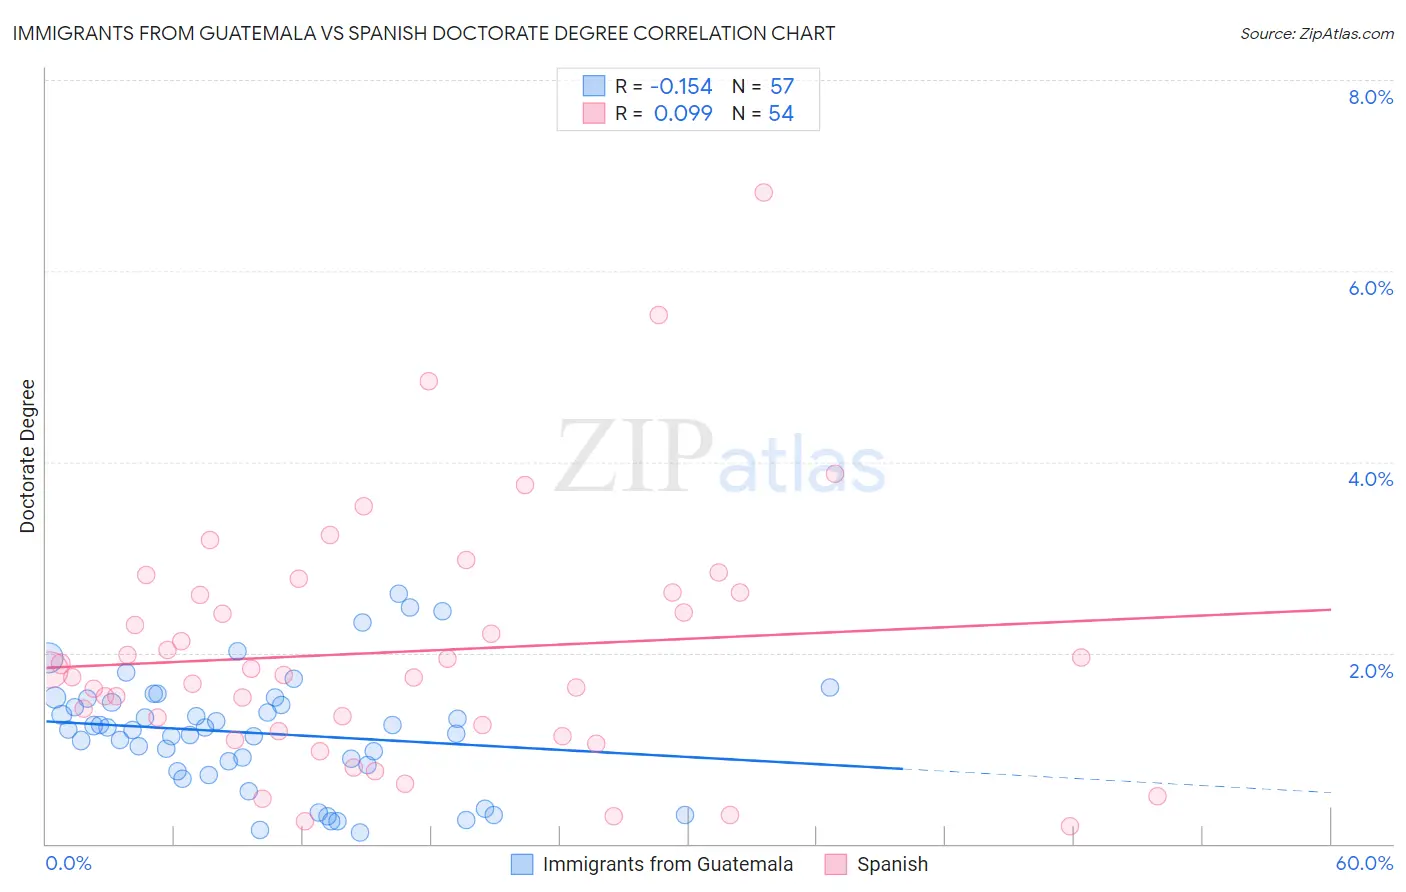
Immigrants from Guatemala vs Spanish Doctorate Degree Correlation Chart
The statistical analysis conducted on geographies consisting of 372,323,954 people shows a poor negative correlation between the proportion of Immigrants from Guatemala and percentage of population with at least doctorate degree education in the United States with a correlation coefficient (R) of -0.154 and weighted average of 1.4%. Similarly, the statistical analysis conducted on geographies consisting of 416,138,041 people shows a slight positive correlation between the proportion of Spanish and percentage of population with at least doctorate degree education in the United States with a correlation coefficient (R) of 0.099 and weighted average of 1.8%, a difference of 32.3%.
Doctorate Degree Correlation Summary
| Measurement | Immigrants from Guatemala | Spanish |
| Minimum | 0.11% | 0.18% |
| Maximum | 2.6% | 6.8% |
| Range | 2.5% | 6.6% |
| Mean | 1.2% | 2.0% |
| Median | 1.2% | 1.8% |
| Interquartile 25% (IQ1) | 0.80% | 1.2% |
| Interquartile 75% (IQ3) | 1.5% | 2.6% |
| Interquartile Range (IQR) | 0.70% | 1.5% |
| Standard Deviation (Sample) | 0.60% | 1.3% |
| Standard Deviation (Population) | 0.59% | 1.3% |
Similar Demographics by Doctorate Degree
Demographics Similar to Immigrants from Guatemala by Doctorate Degree
In terms of doctorate degree, the demographic groups most similar to Immigrants from Guatemala are Honduran (1.4%, a difference of 0.070%), Belizean (1.4%, a difference of 0.33%), Shoshone (1.4%, a difference of 0.40%), Immigrants from Dominica (1.4%, a difference of 0.42%), and Mexican American Indian (1.4%, a difference of 0.48%).
| Demographics | Rating | Rank | Doctorate Degree |
| Immigrants | Yemen | 0.2 /100 | #293 | Tragic 1.4% |
| Samoans | 0.2 /100 | #294 | Tragic 1.4% |
| Guatemalans | 0.2 /100 | #295 | Tragic 1.4% |
| Immigrants | Ecuador | 0.2 /100 | #296 | Tragic 1.4% |
| Tsimshian | 0.2 /100 | #297 | Tragic 1.4% |
| Puerto Ricans | 0.1 /100 | #298 | Tragic 1.4% |
| Belizeans | 0.1 /100 | #299 | Tragic 1.4% |
| Immigrants | Guatemala | 0.1 /100 | #300 | Tragic 1.4% |
| Hondurans | 0.1 /100 | #301 | Tragic 1.4% |
| Shoshone | 0.1 /100 | #302 | Tragic 1.4% |
| Immigrants | Dominica | 0.1 /100 | #303 | Tragic 1.4% |
| Mexican American Indians | 0.1 /100 | #304 | Tragic 1.4% |
| Pennsylvania Germans | 0.1 /100 | #305 | Tragic 1.4% |
| Guyanese | 0.1 /100 | #306 | Tragic 1.4% |
| Cubans | 0.1 /100 | #307 | Tragic 1.4% |
Demographics Similar to Spanish by Doctorate Degree
In terms of doctorate degree, the demographic groups most similar to Spanish are Iraqi (1.8%, a difference of 0.010%), Immigrants from Thailand (1.8%, a difference of 0.020%), French (1.8%, a difference of 0.070%), Norwegian (1.8%, a difference of 0.10%), and Immigrants from Bangladesh (1.8%, a difference of 0.10%).
| Demographics | Rating | Rank | Doctorate Degree |
| Vietnamese | 54.8 /100 | #169 | Average 1.9% |
| Costa Ricans | 53.3 /100 | #170 | Average 1.8% |
| Bermudans | 52.1 /100 | #171 | Average 1.8% |
| Belgians | 50.3 /100 | #172 | Average 1.8% |
| Norwegians | 50.0 /100 | #173 | Average 1.8% |
| Immigrants | Bangladesh | 50.0 /100 | #174 | Average 1.8% |
| Immigrants | Thailand | 49.4 /100 | #175 | Average 1.8% |
| Spanish | 49.3 /100 | #176 | Average 1.8% |
| Iraqis | 49.2 /100 | #177 | Average 1.8% |
| French | 48.8 /100 | #178 | Average 1.8% |
| Ghanaians | 48.3 /100 | #179 | Average 1.8% |
| Scandinavians | 48.0 /100 | #180 | Average 1.8% |
| Immigrants | Immigrants | 46.2 /100 | #181 | Average 1.8% |
| Immigrants | Afghanistan | 44.3 /100 | #182 | Average 1.8% |
| Finns | 42.1 /100 | #183 | Average 1.8% |